To give back, and finish well
By Don | November 19, 2023
The above Welcome! paragraph is what we wrote as we retired at the end of 2013.
Now after being retired for almost 10 years, I was reflecting recently on the process Leslie and I went through in our early 60s as we began considerations for “retiring”. We were still very active in our real estate business, in our church and in our community. Our philosophy for future plans centered around the idea “to give back, and finish well”.
We were both active in leadership at our church (Ventura Missionary), taught an ESL (English as a Second Language) class Wednesday nights at the Senior Center on Ventura Avenue through Laubach Literacy, and I was involved working with a youth program (Ventura Military Explorer group) at the Experimental Aircraft Association (EAA) hangar at Camarillo airport guiding high school students in building an airplane (a replica of a 1930s era Tiger Moth).
Ultimately, we came up with a plan, were intentional in pursuing it, and now get to look back to see how it all worked out.
At the beginning of 2013 we slowly started winding down our business, converting paper files, escrows, etc, into digital format and shredding, shredding and more shredding of paperwork going back years. We began downsizing our home, selling almost all of our furniture and ultimately putting the keepsakes into a 16′ POD container for long term storage. We leased out our home.

A serious decision is to sell all your furniture and “stuff”, keep the keepsakes in a PODS, then lease out your home to live out of the country.
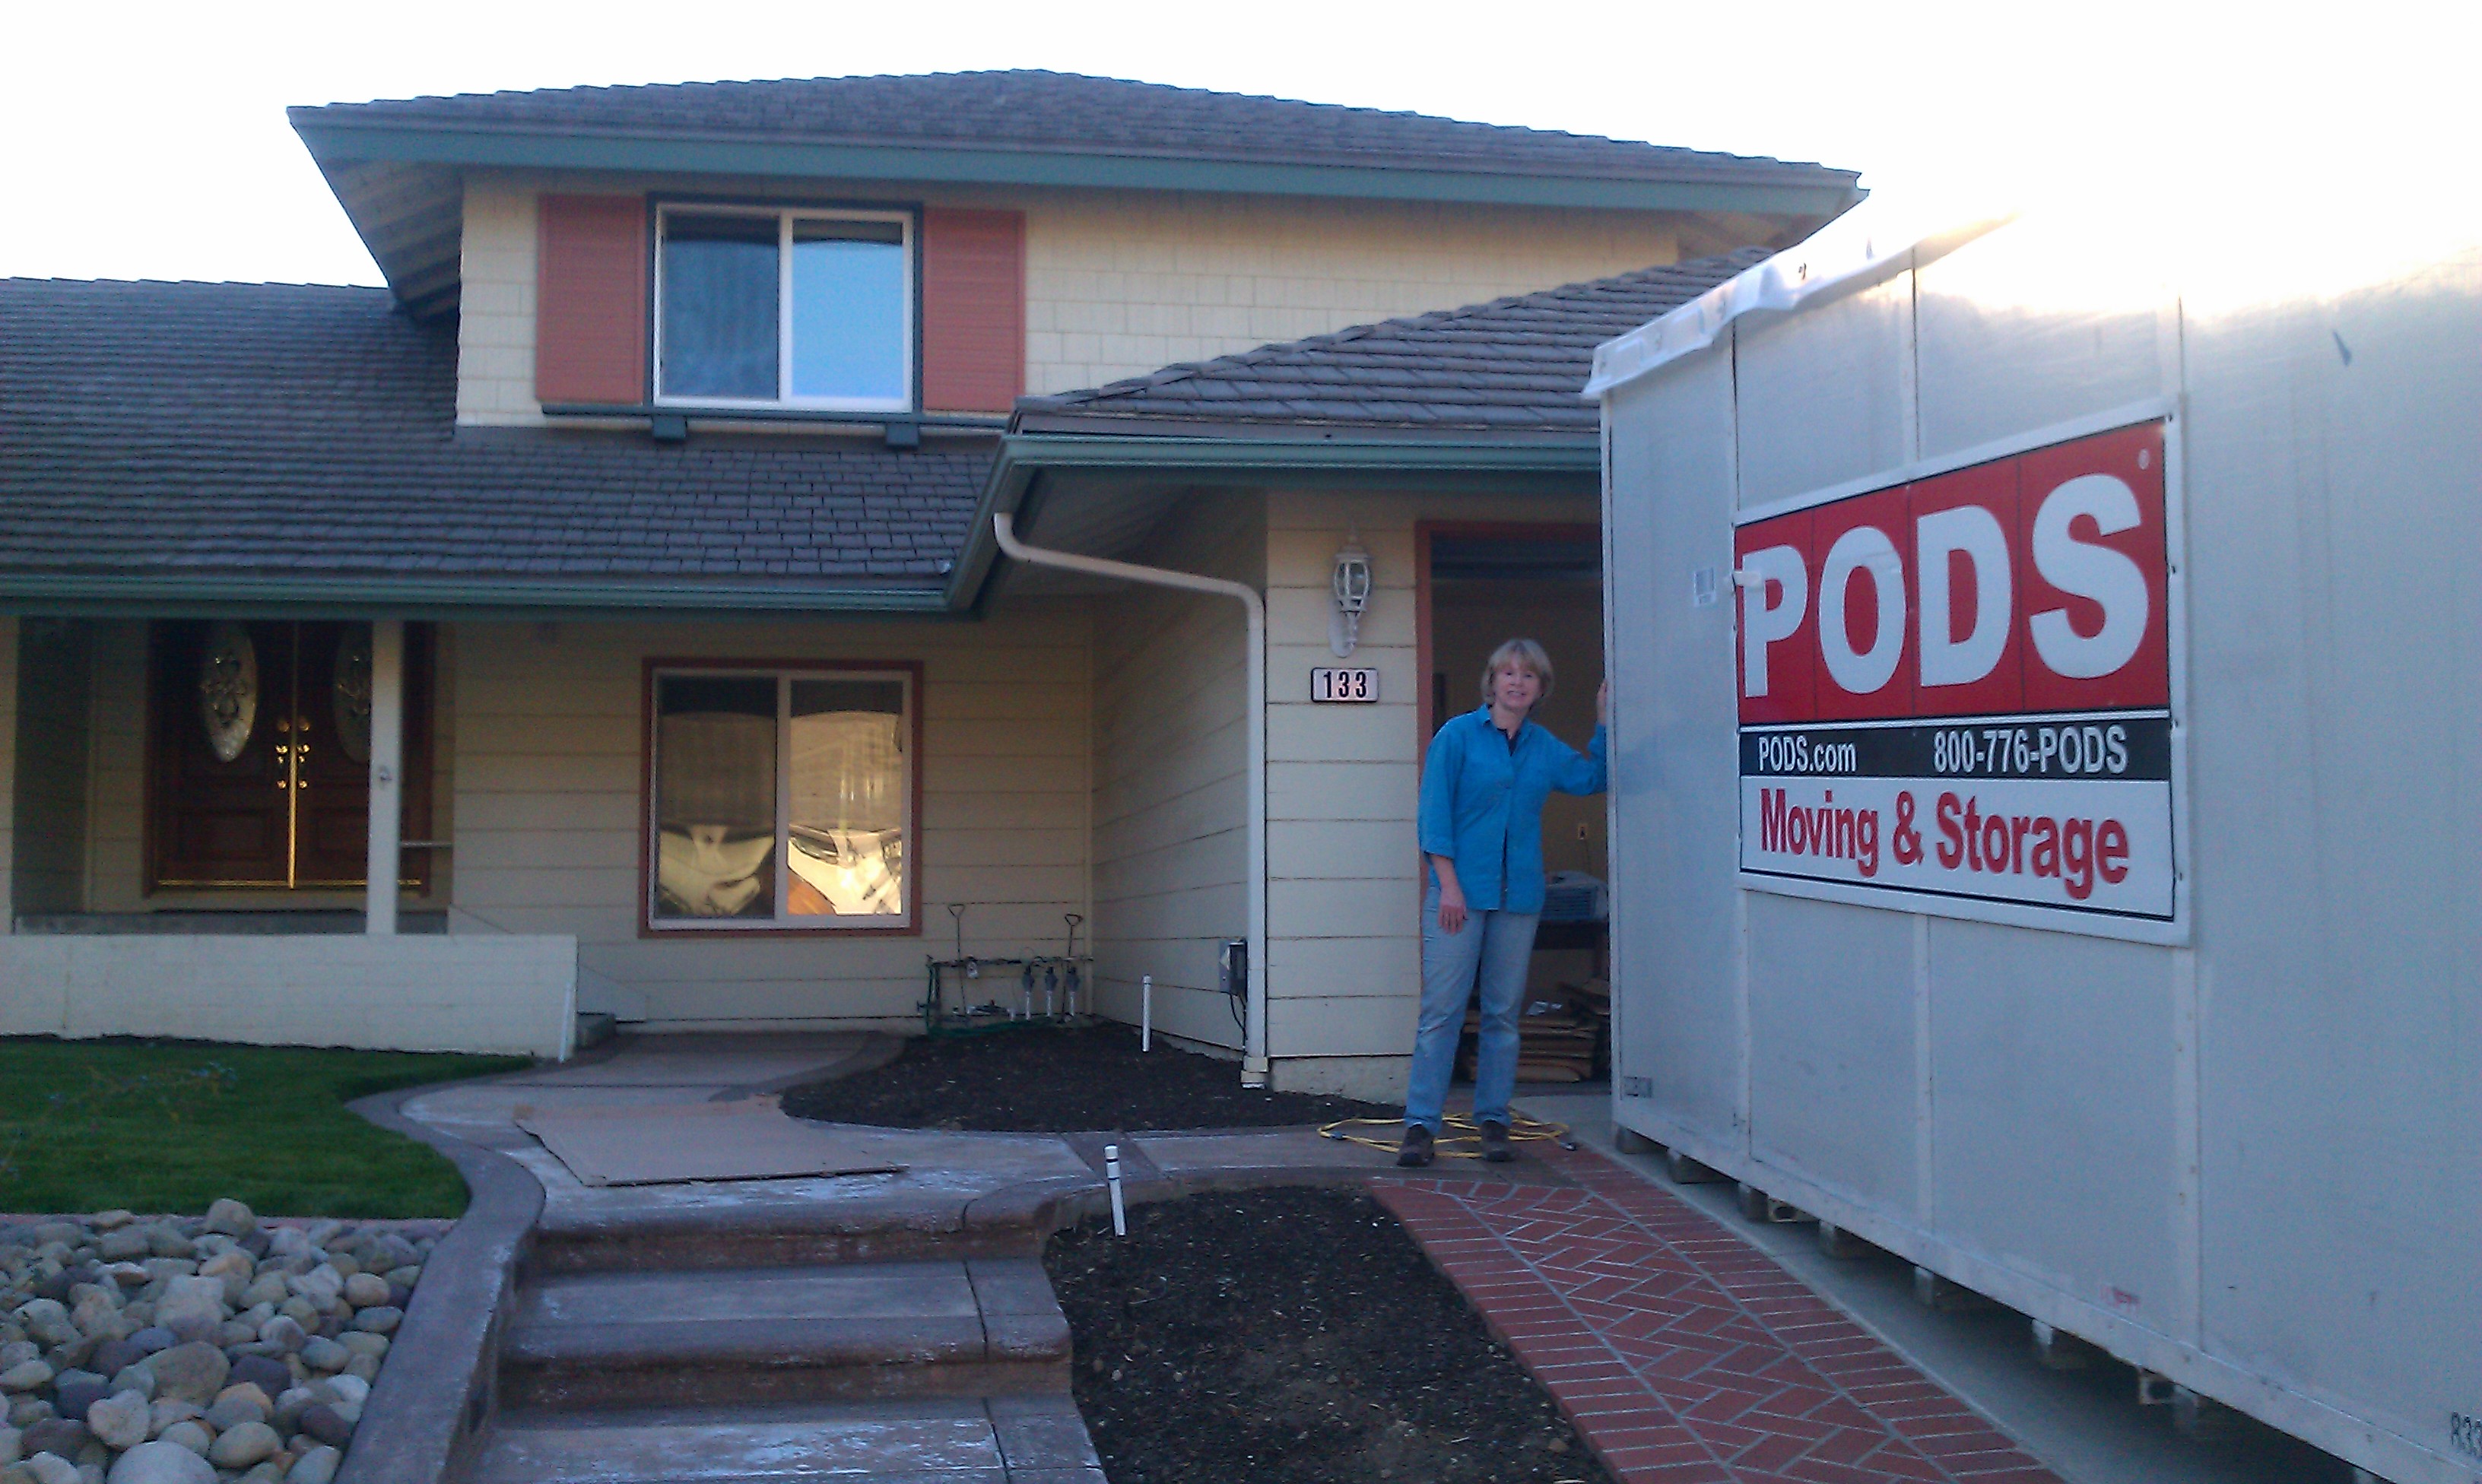
An empty house. We were now “homeless”!
Our goal was to join the Peace Corps, but we were told it would be very difficult for an older couple with no transferable skill (medical, education, ag, etc) to be accepted. So – we needed to build our resume.
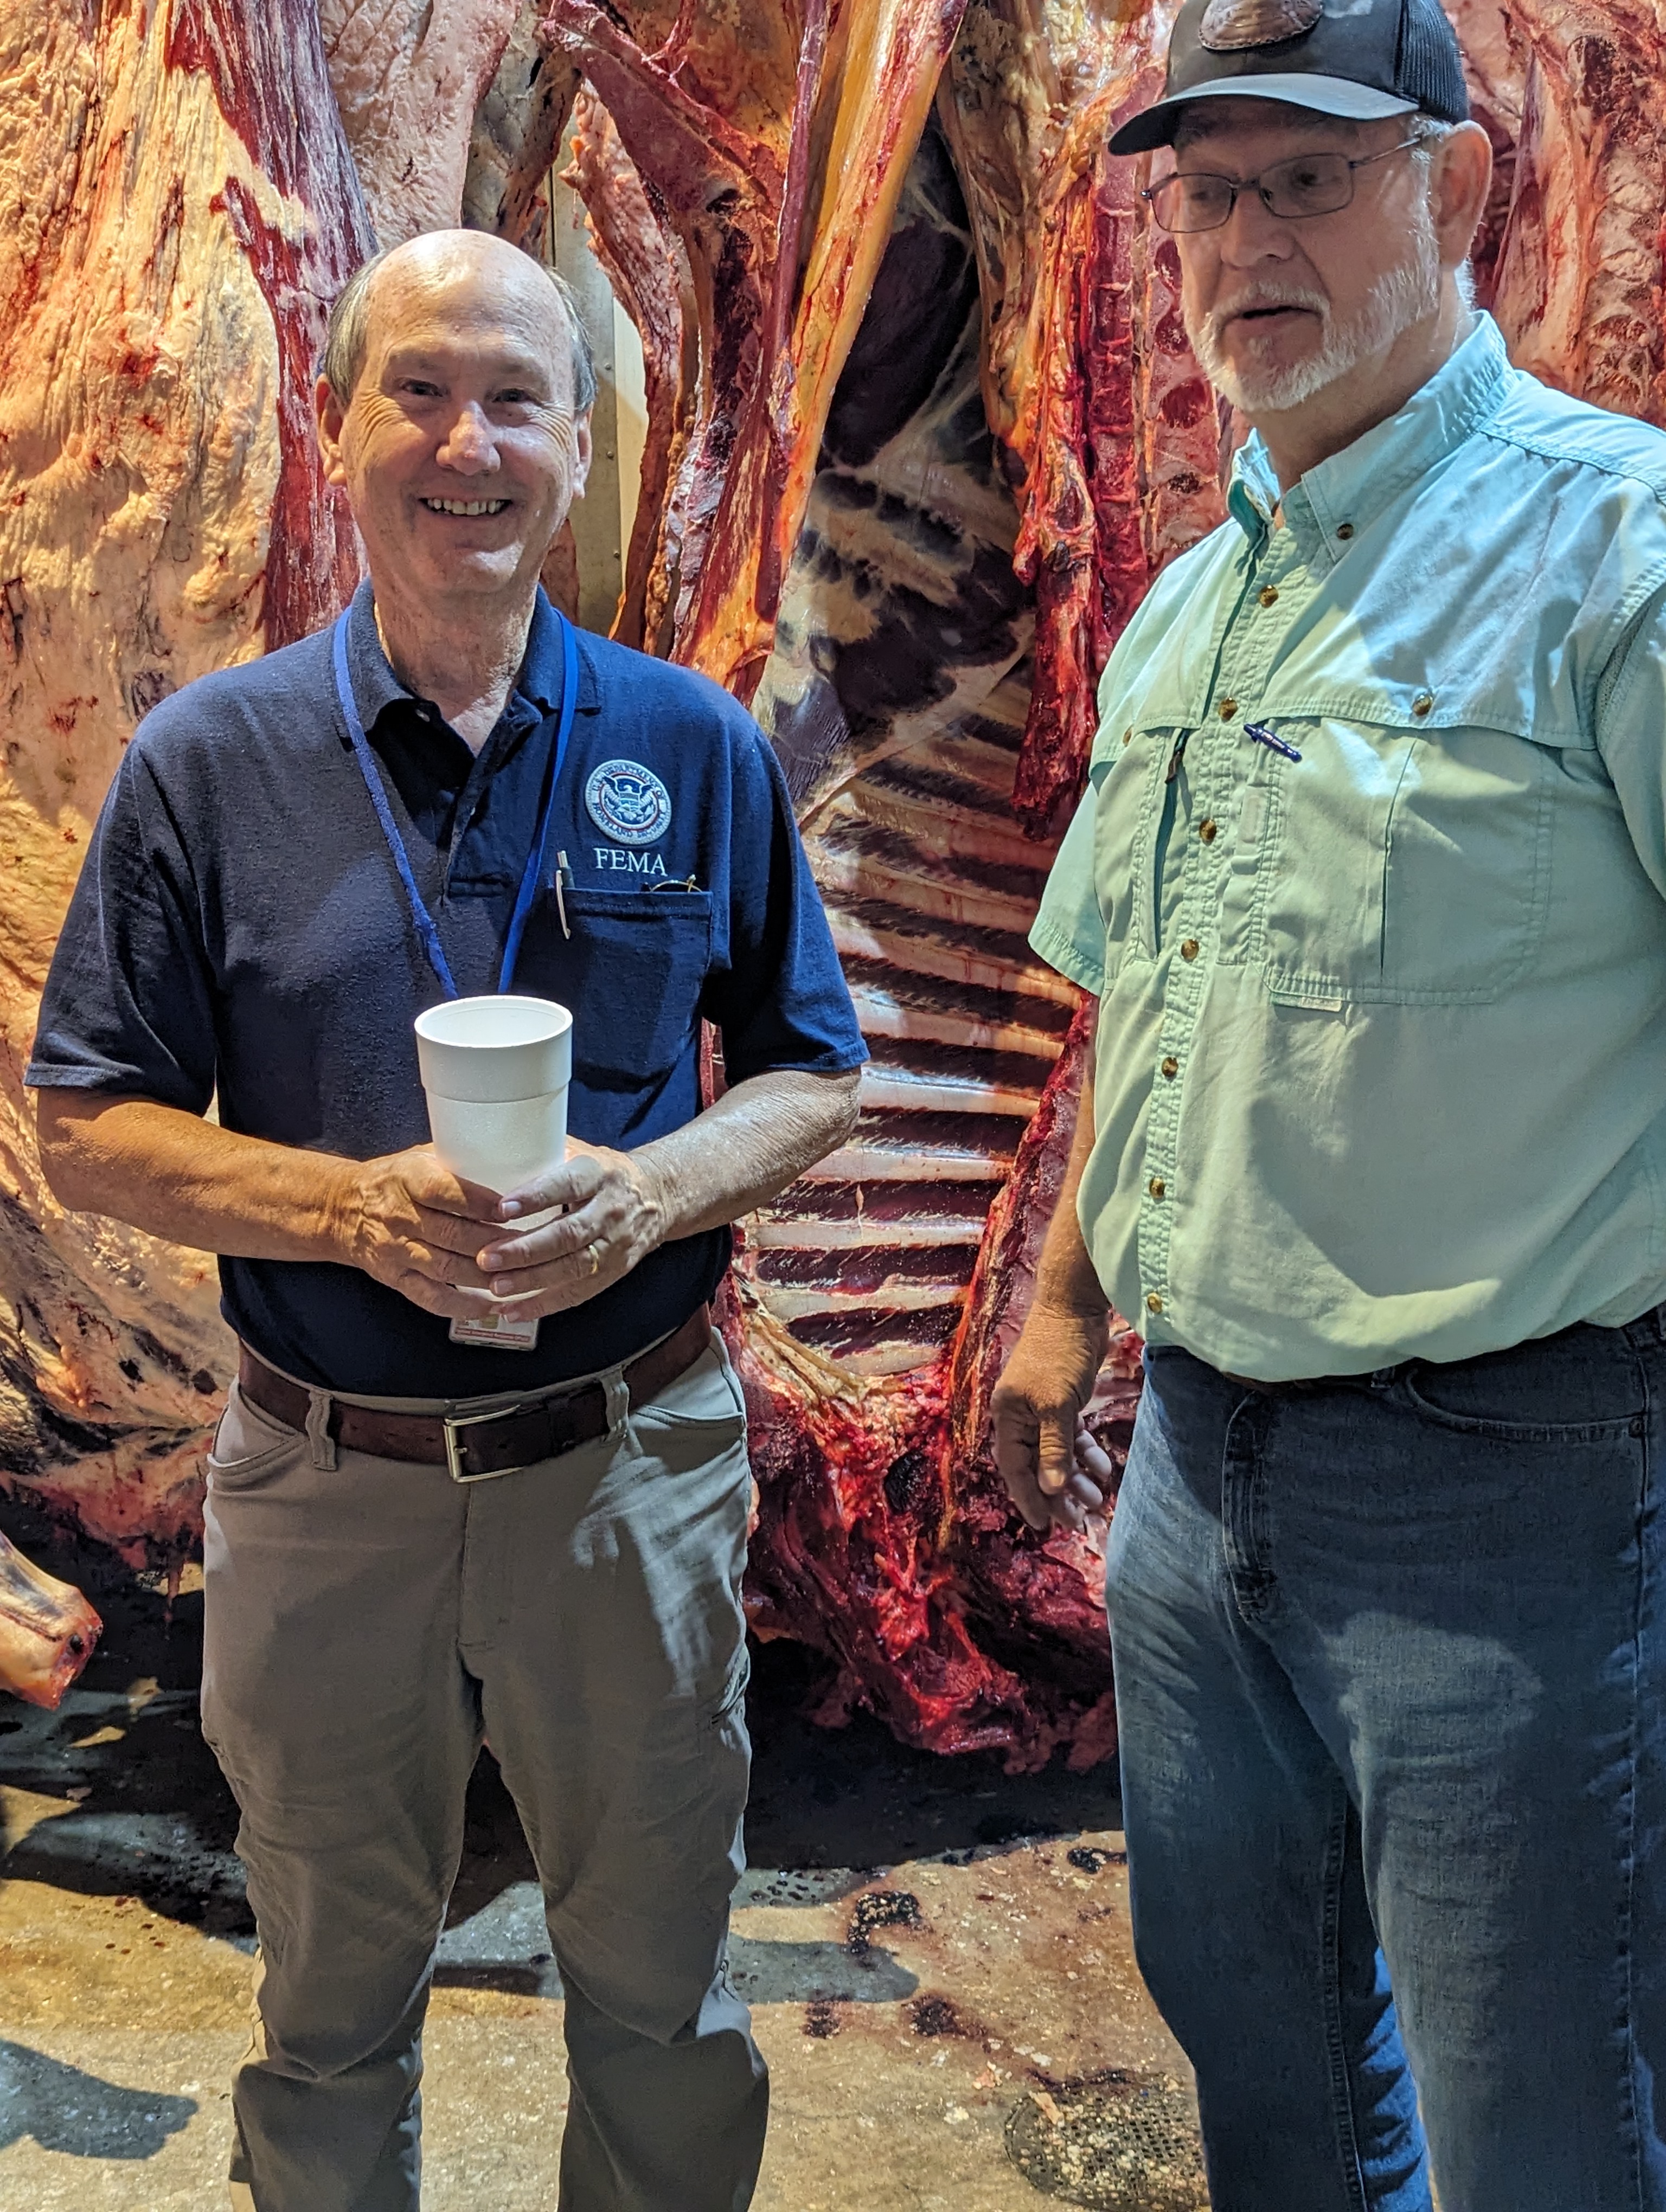
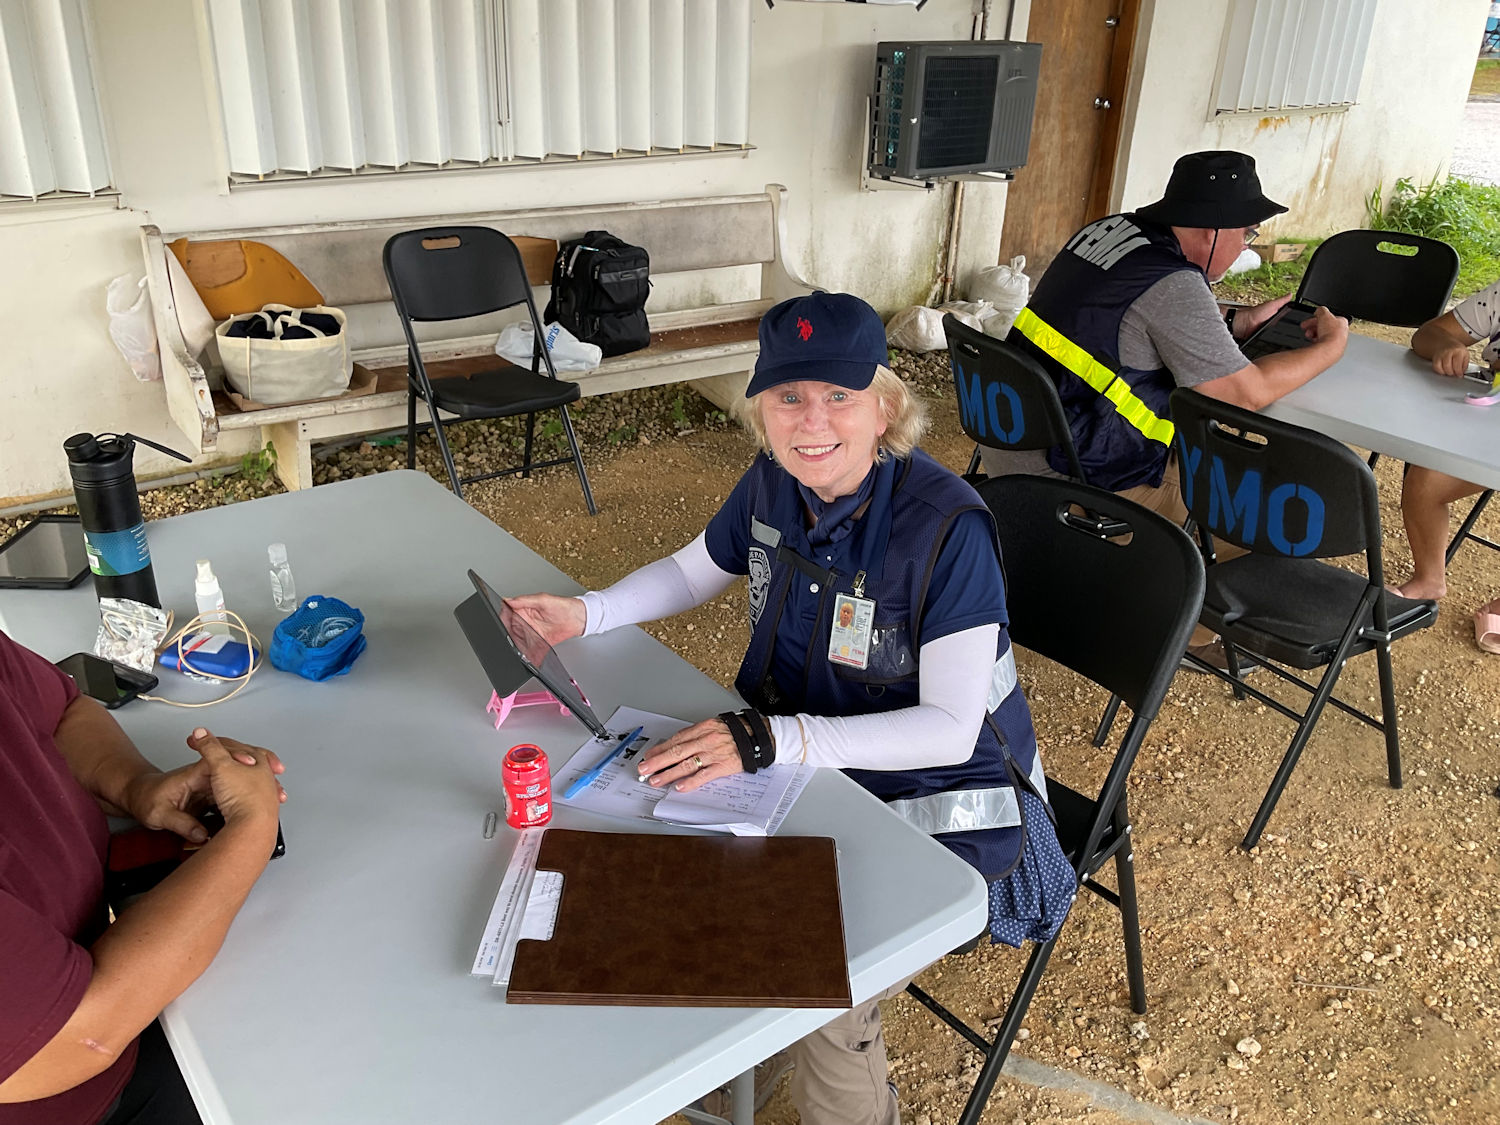
We started our journey to the Peace Corps in Mexico City, moved to Guatemala, were still active Reservists with FEMA, and ultimately in 2017 were accepted into the Peace Corps to serve in Guatemala. But God had other plans for us because we ultimately did not join the Peace Corps but stayed as Reservists with FEMA.
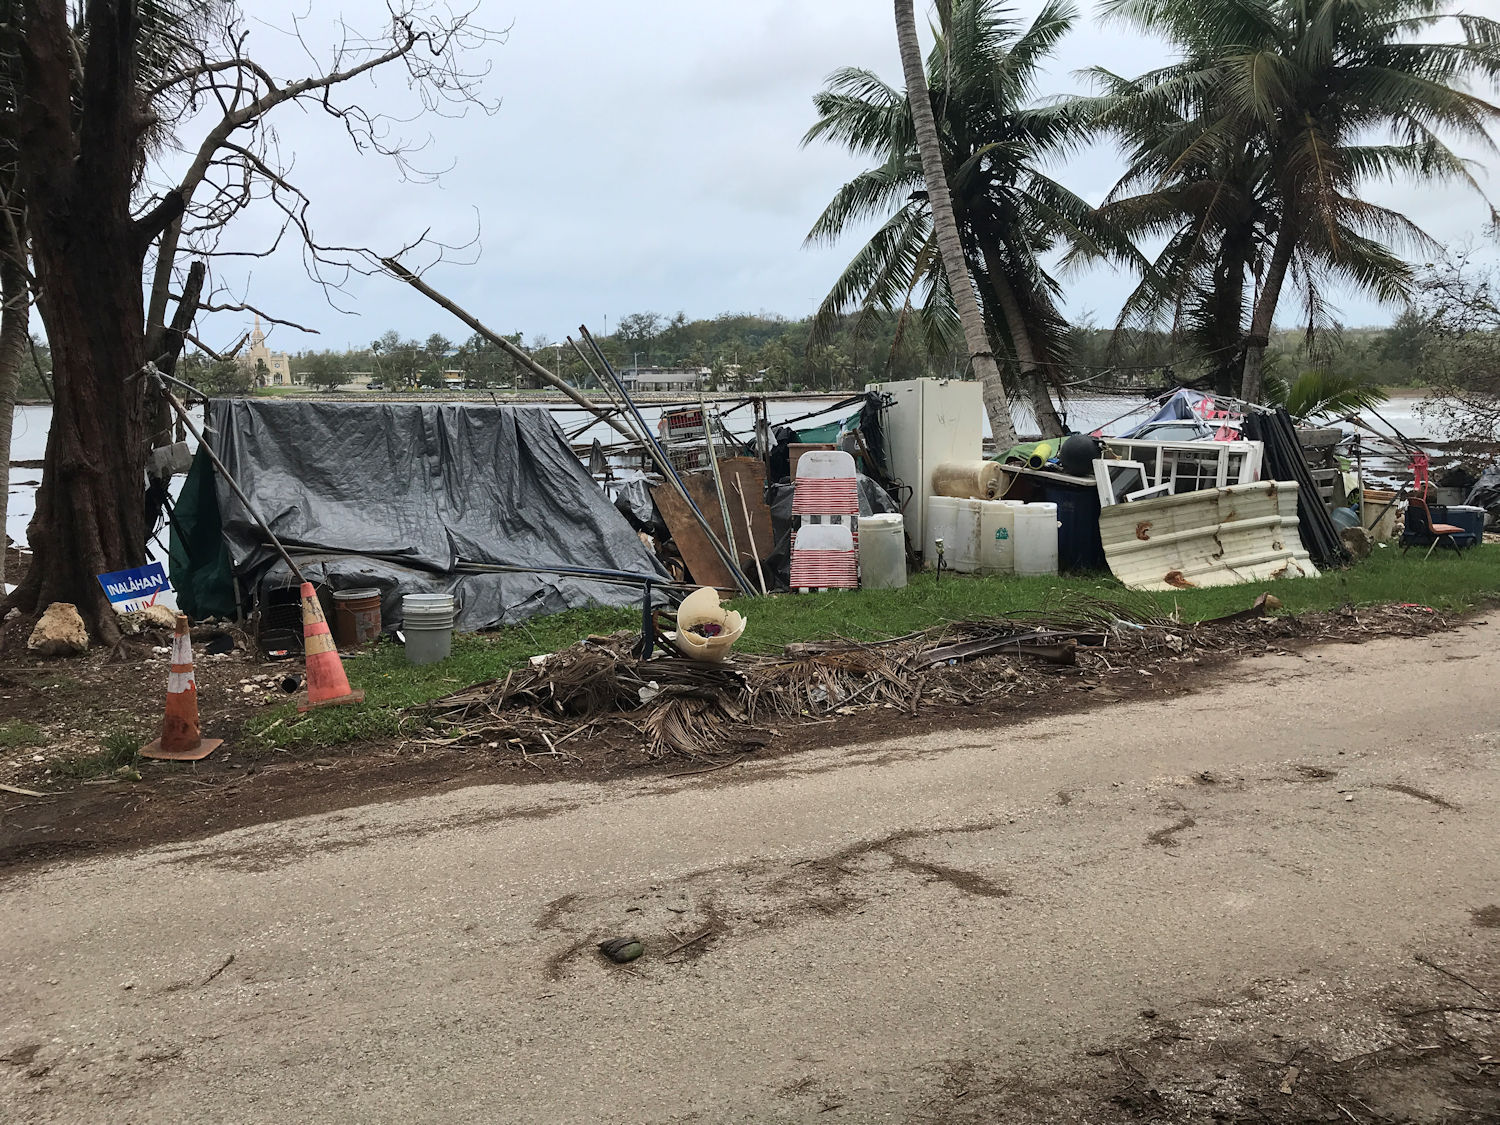
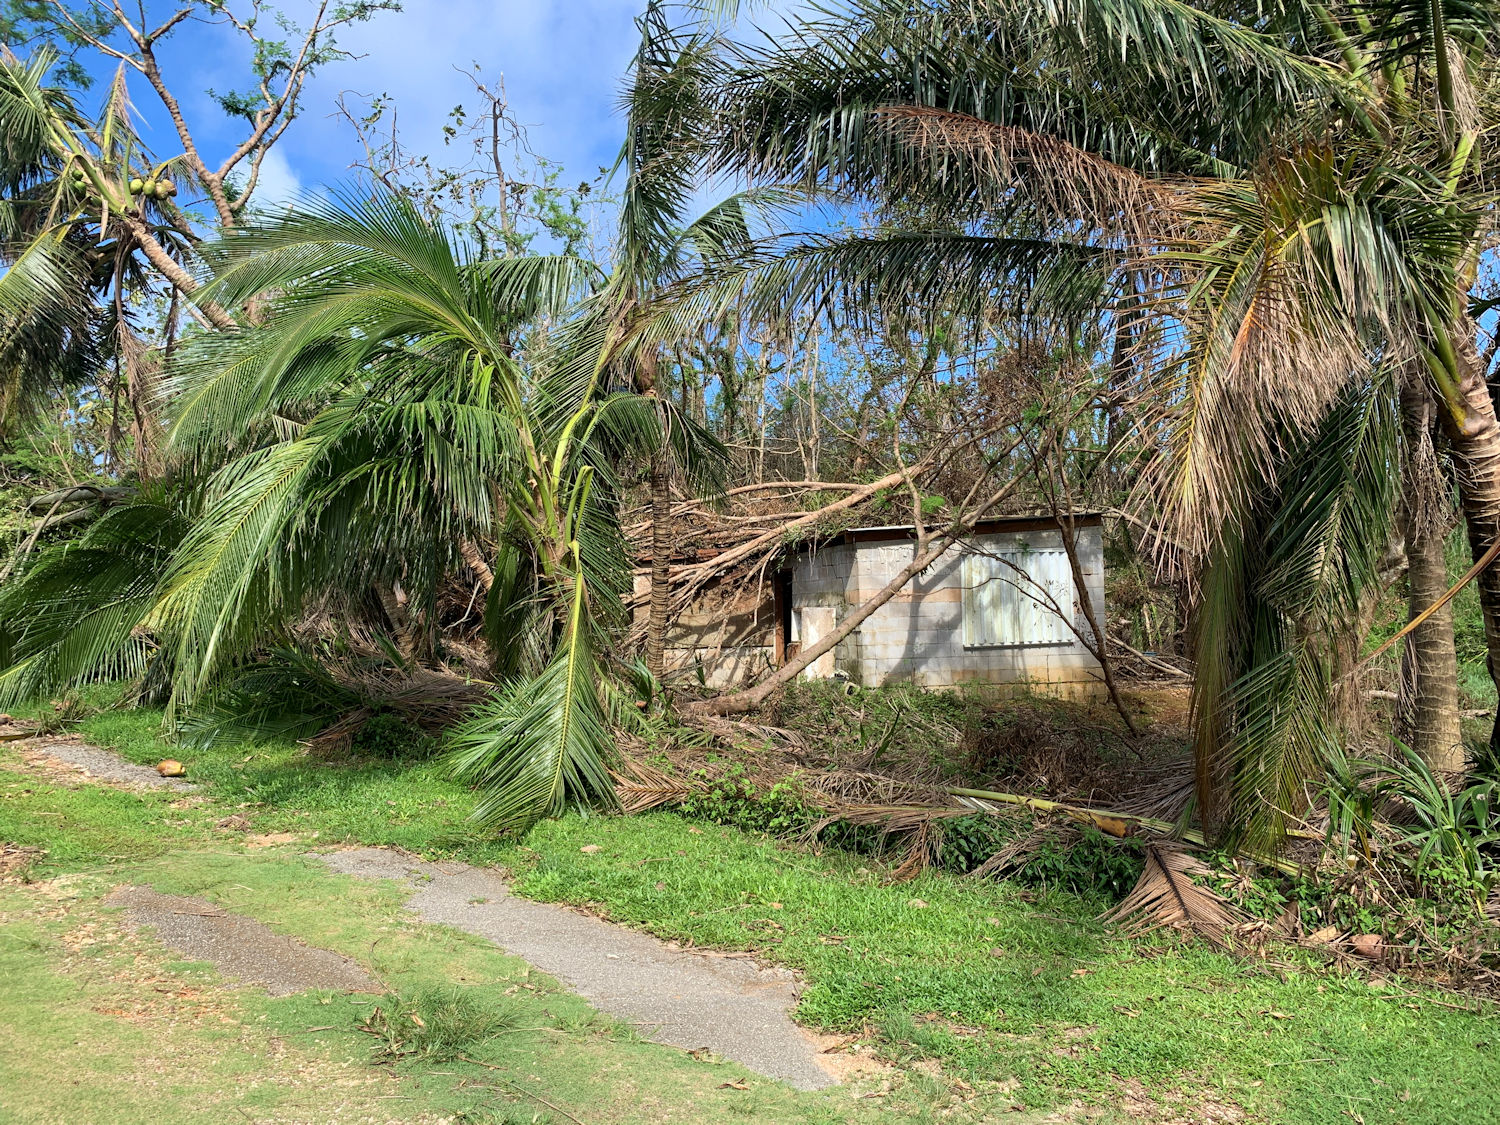
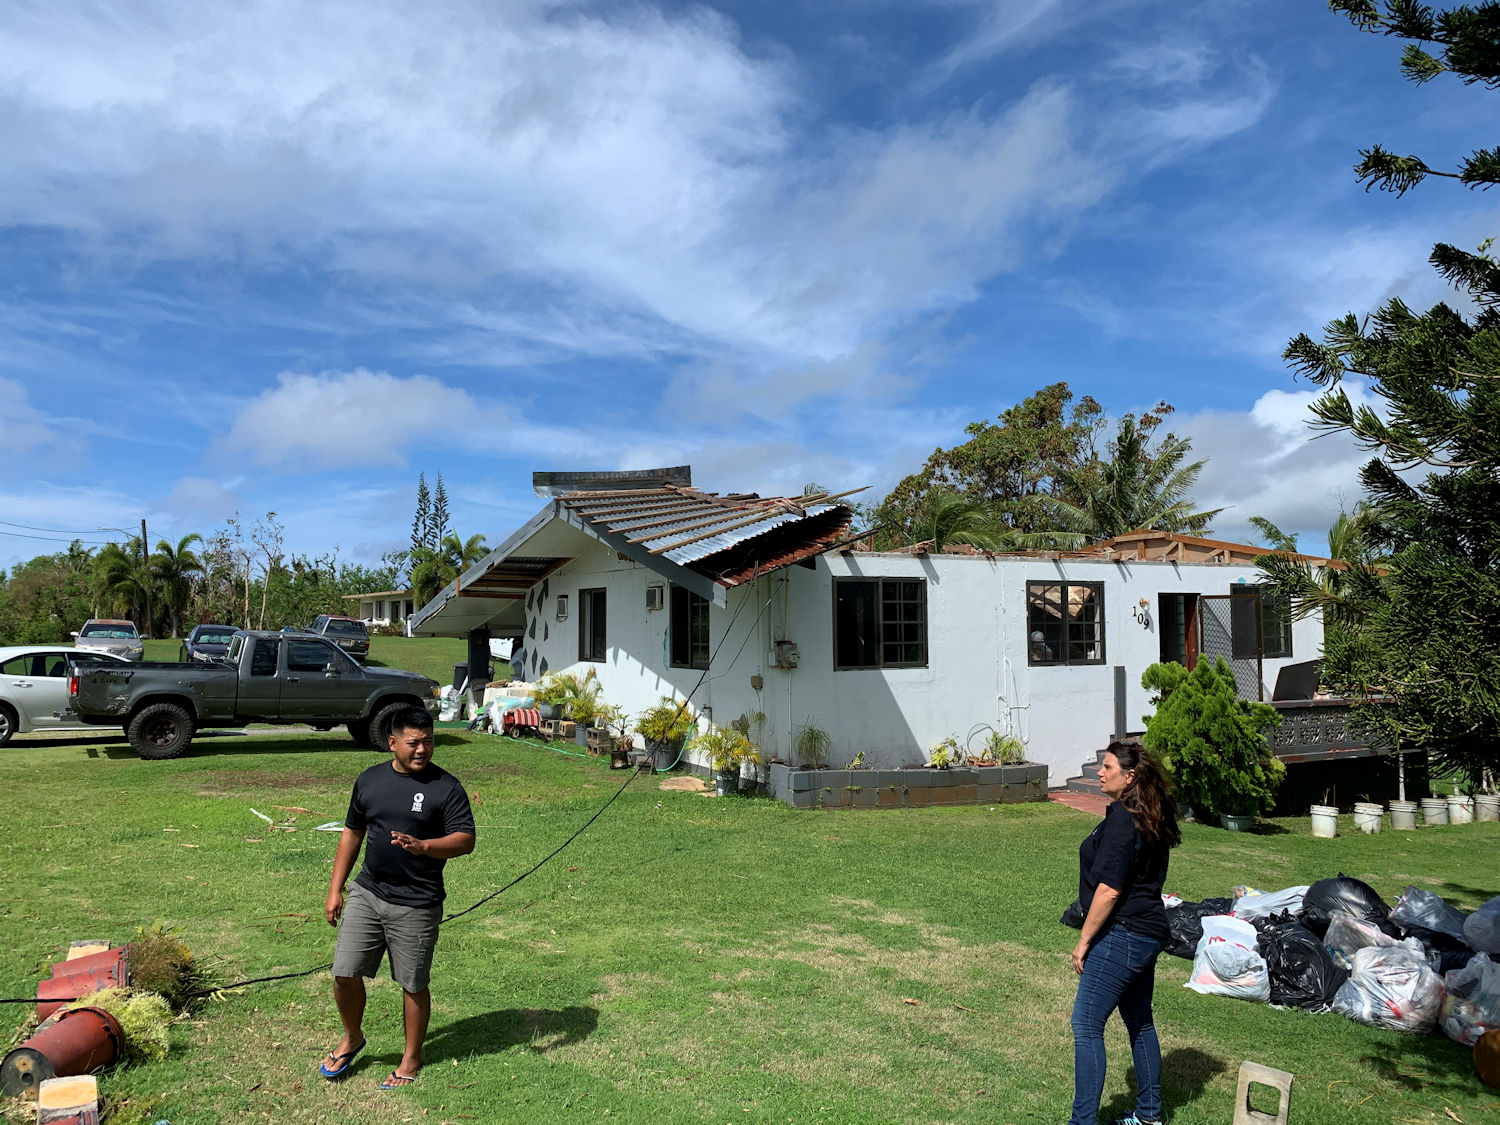
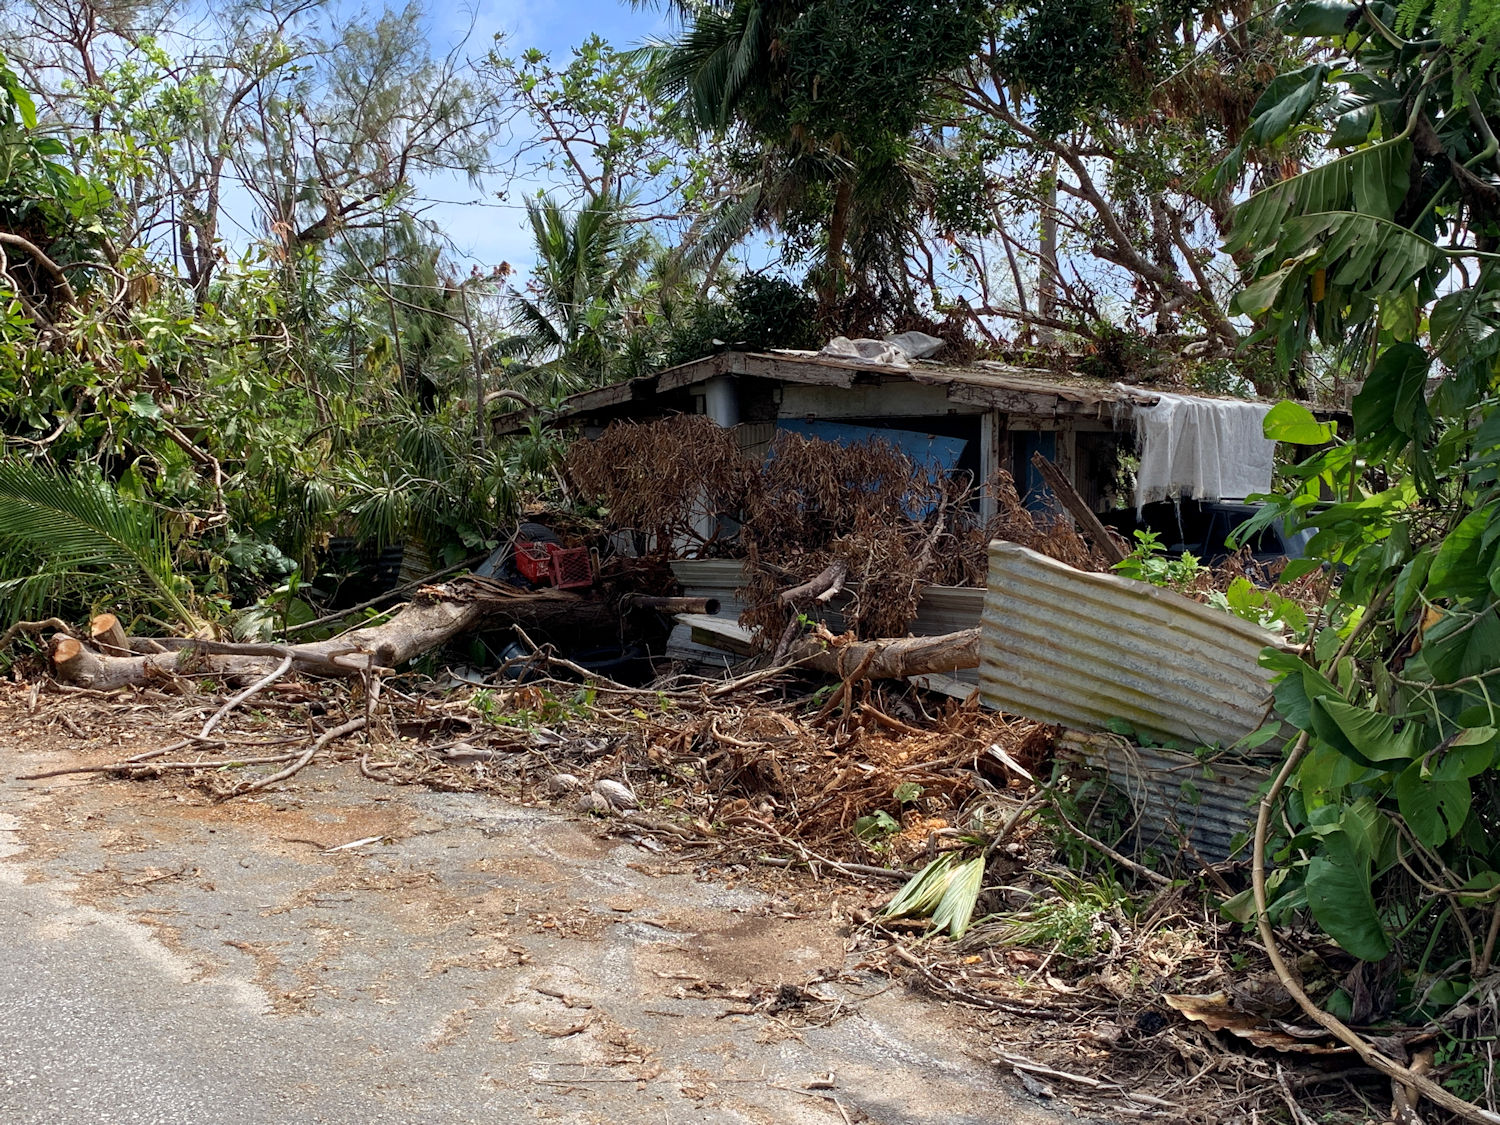
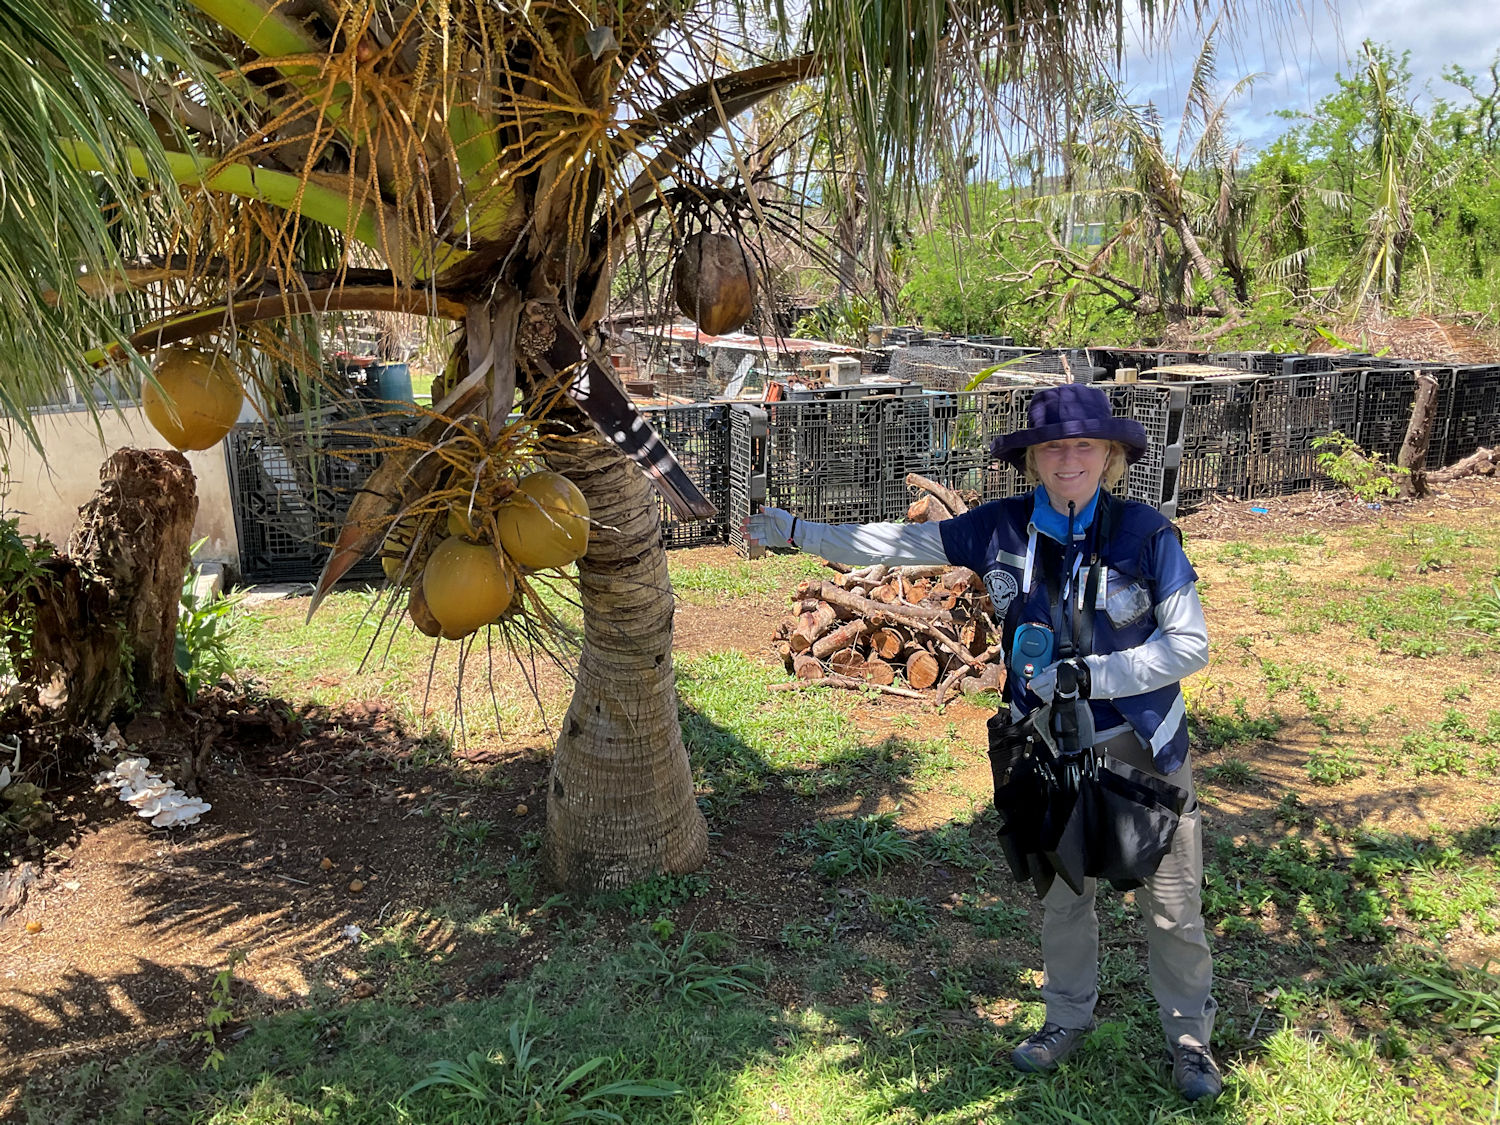
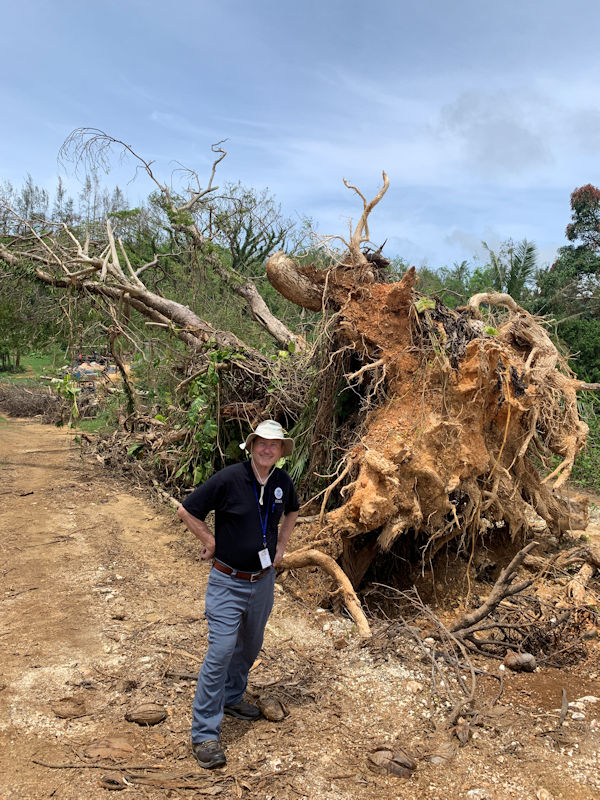
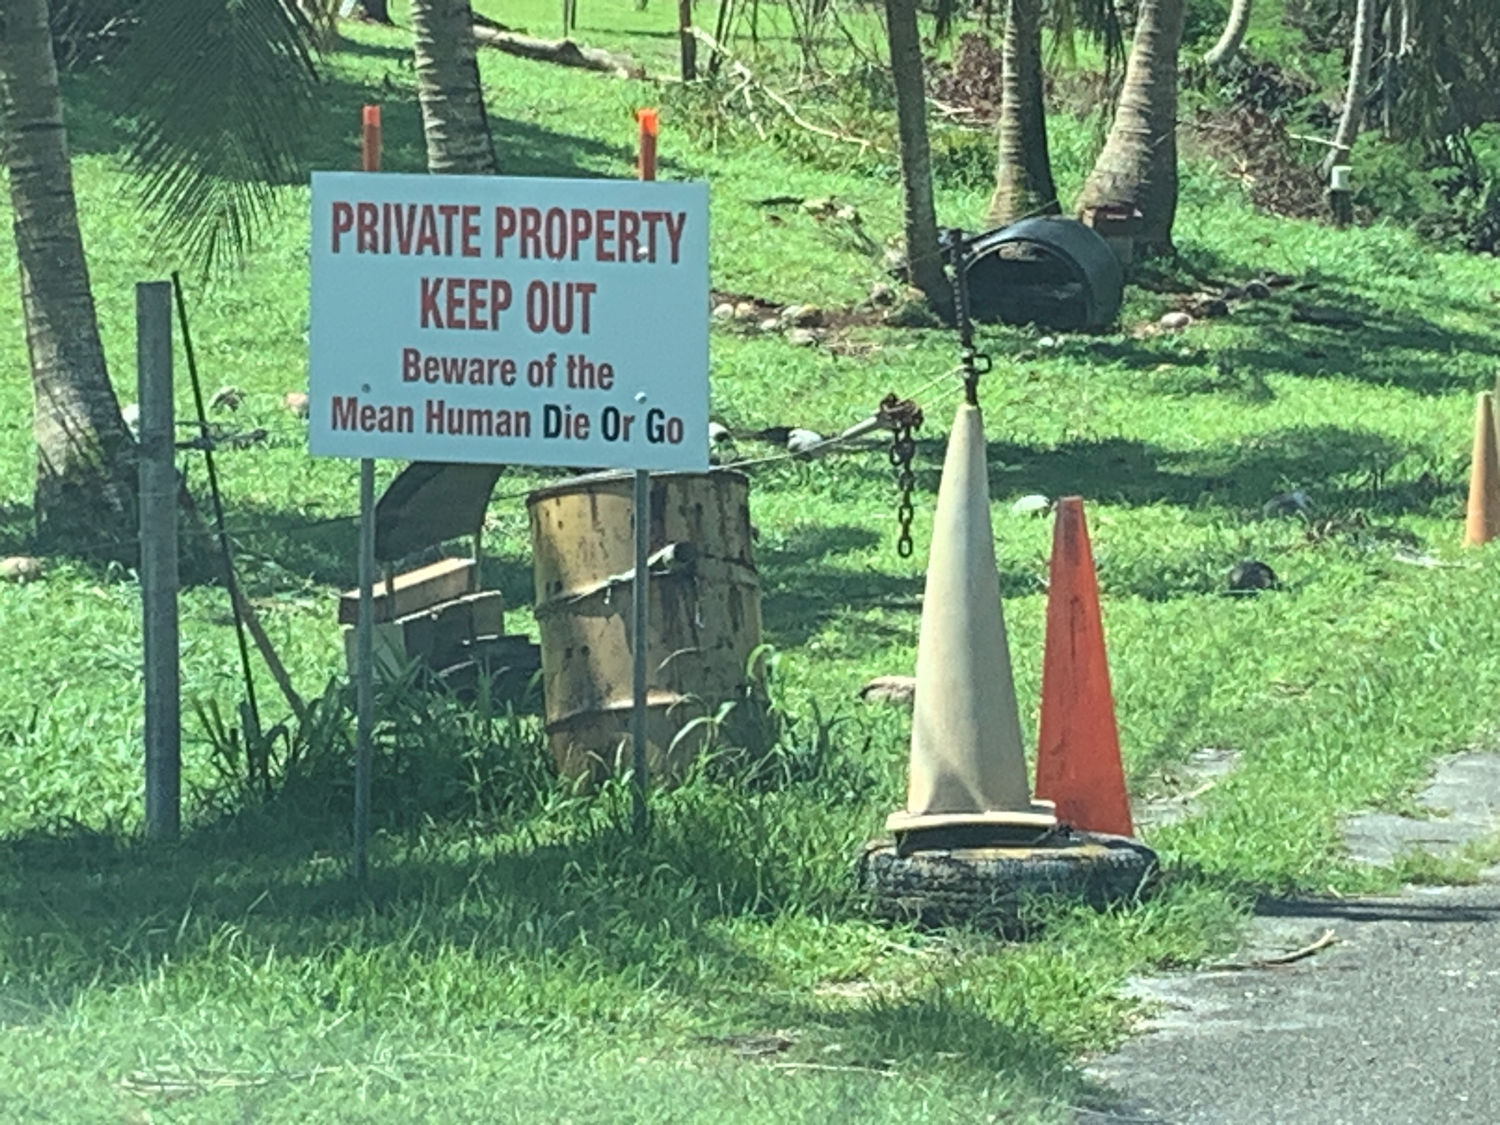
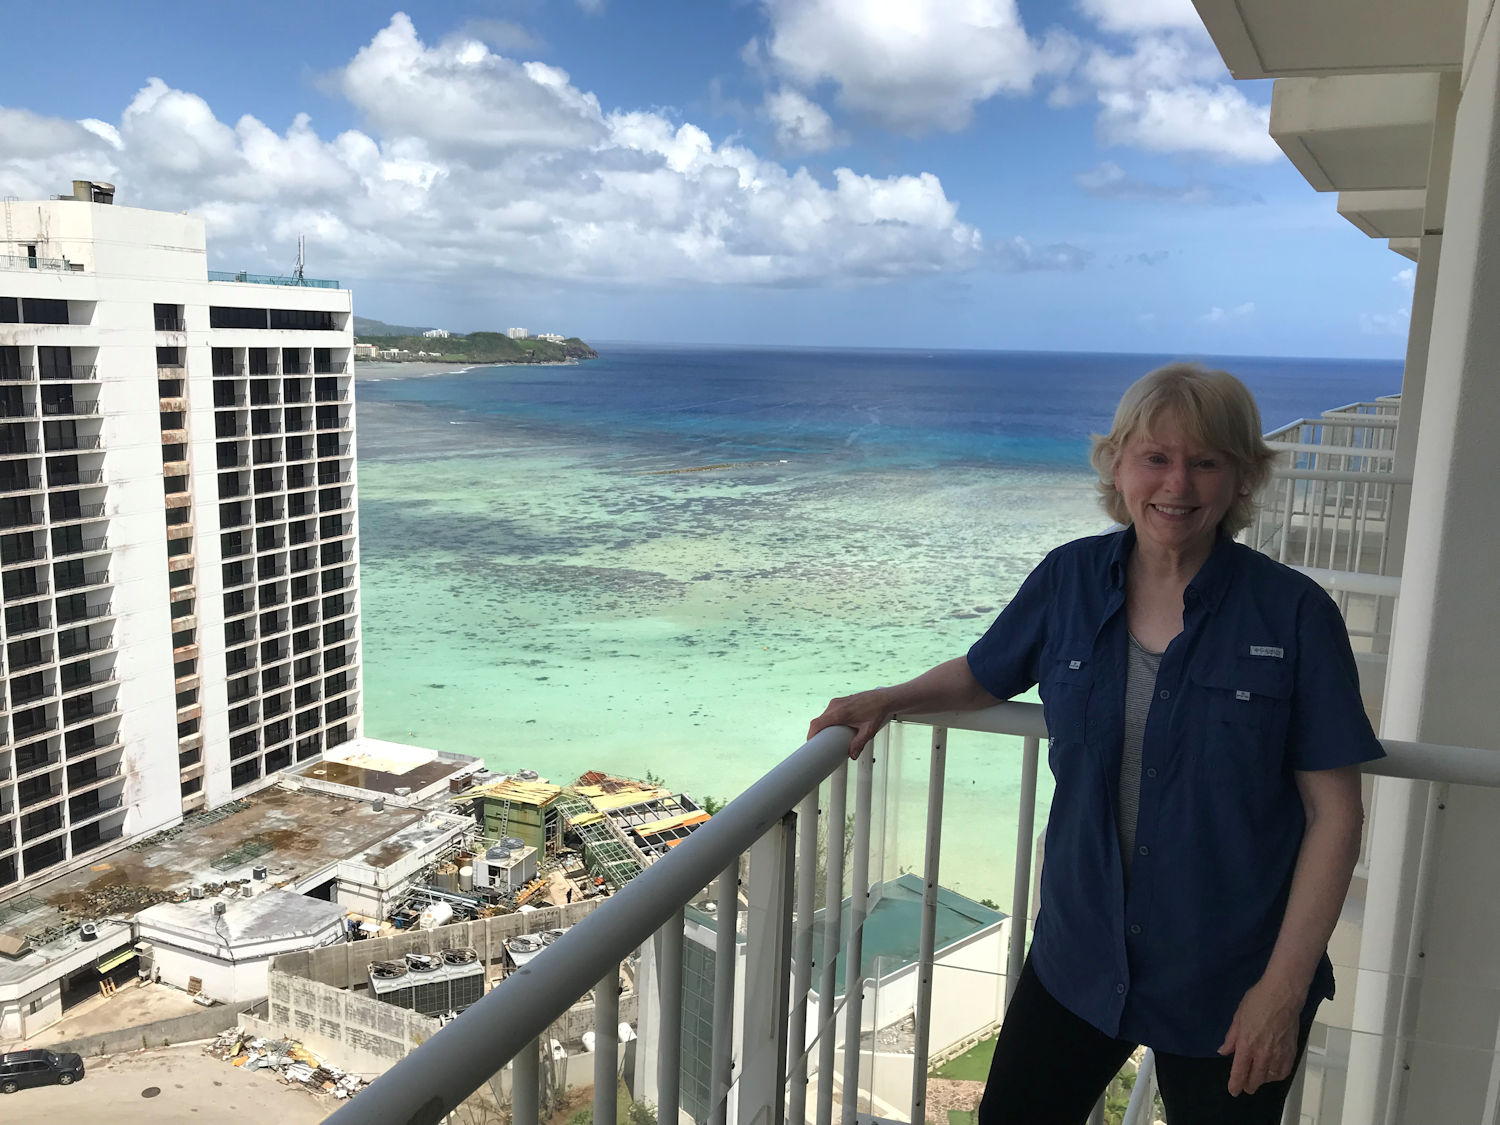
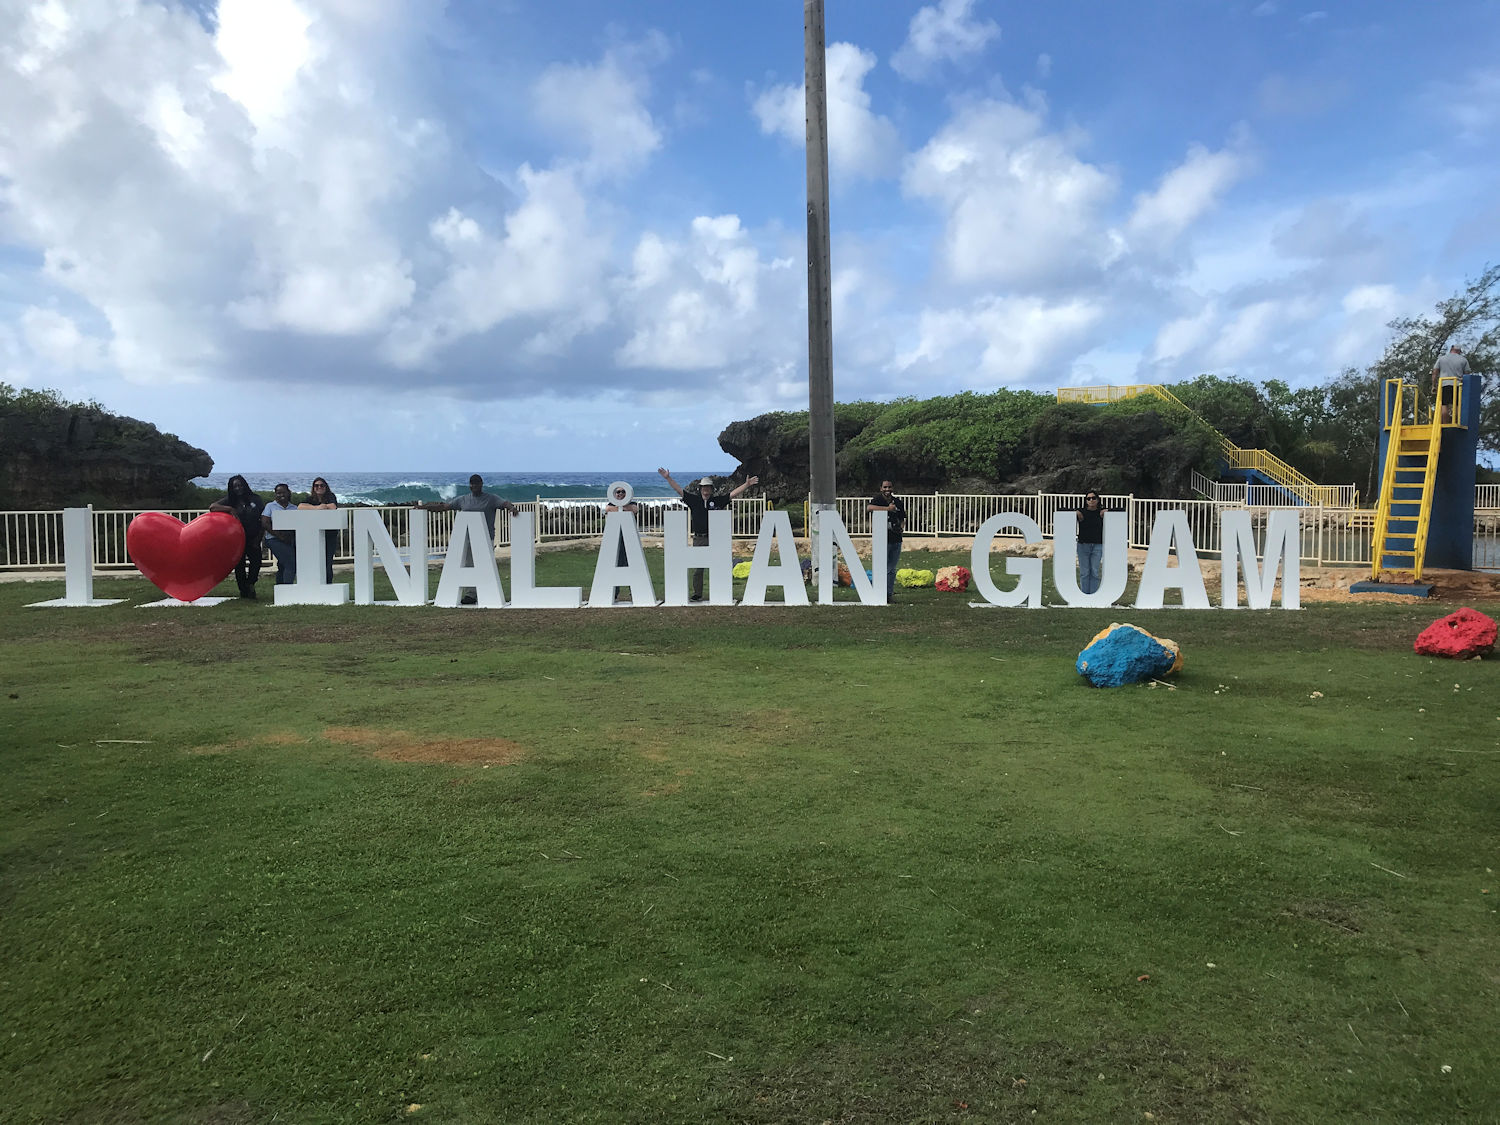
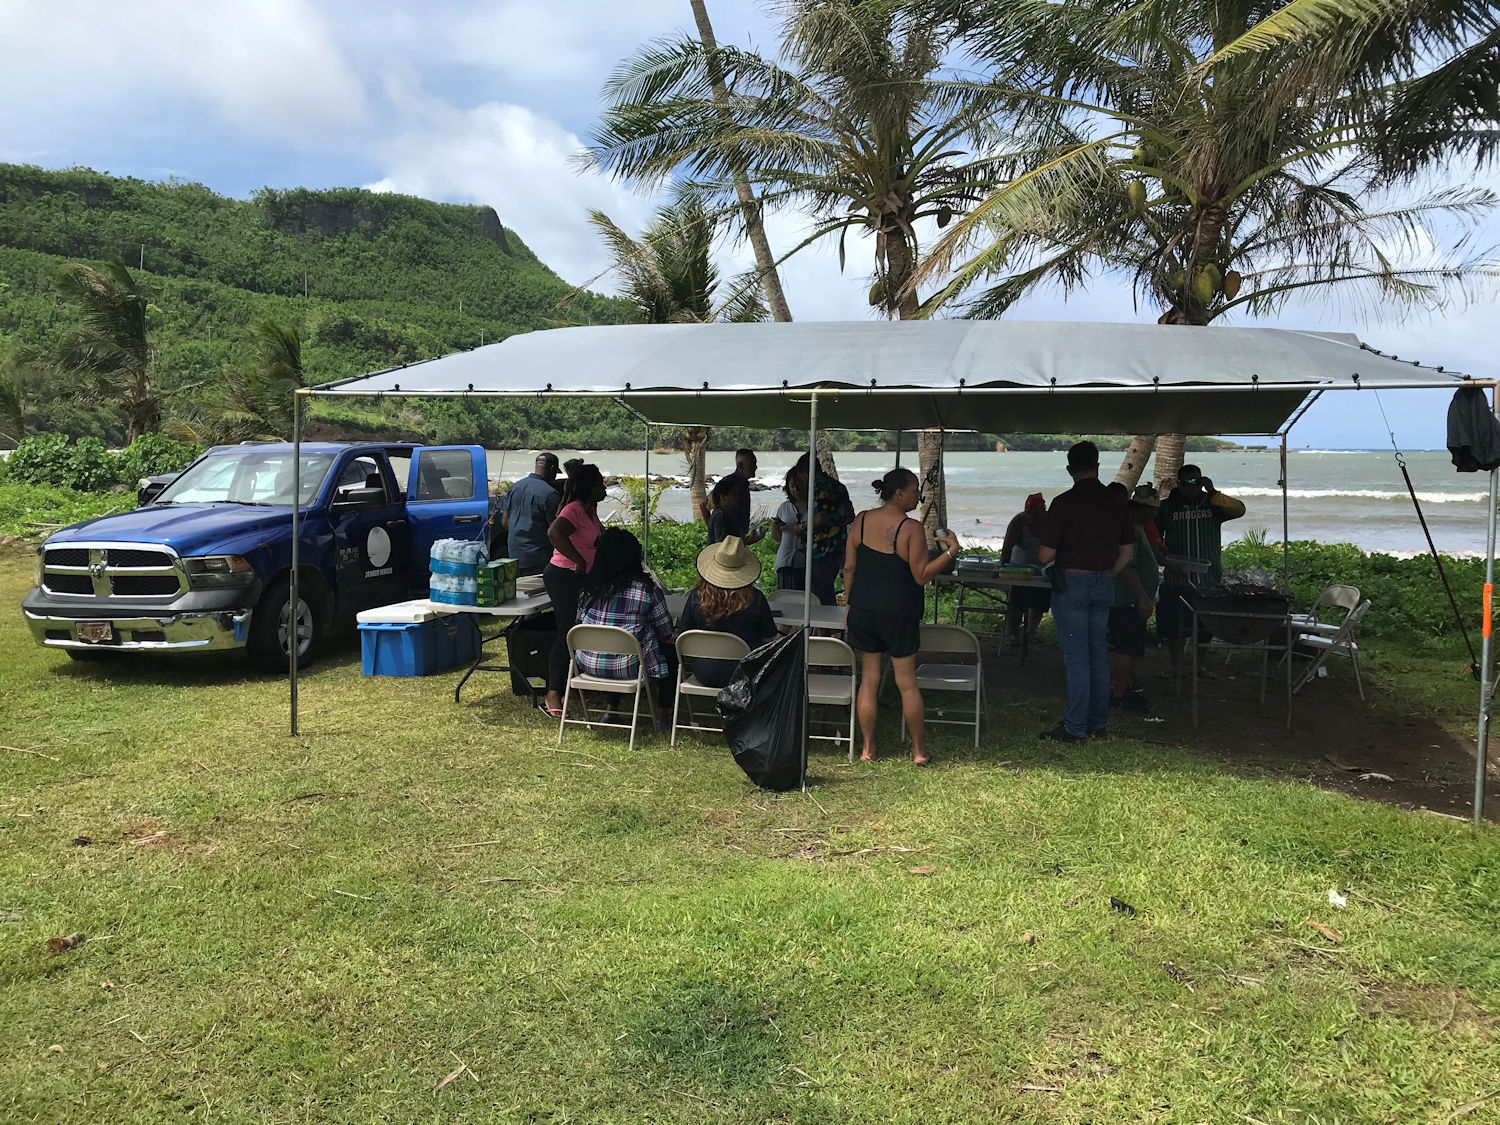
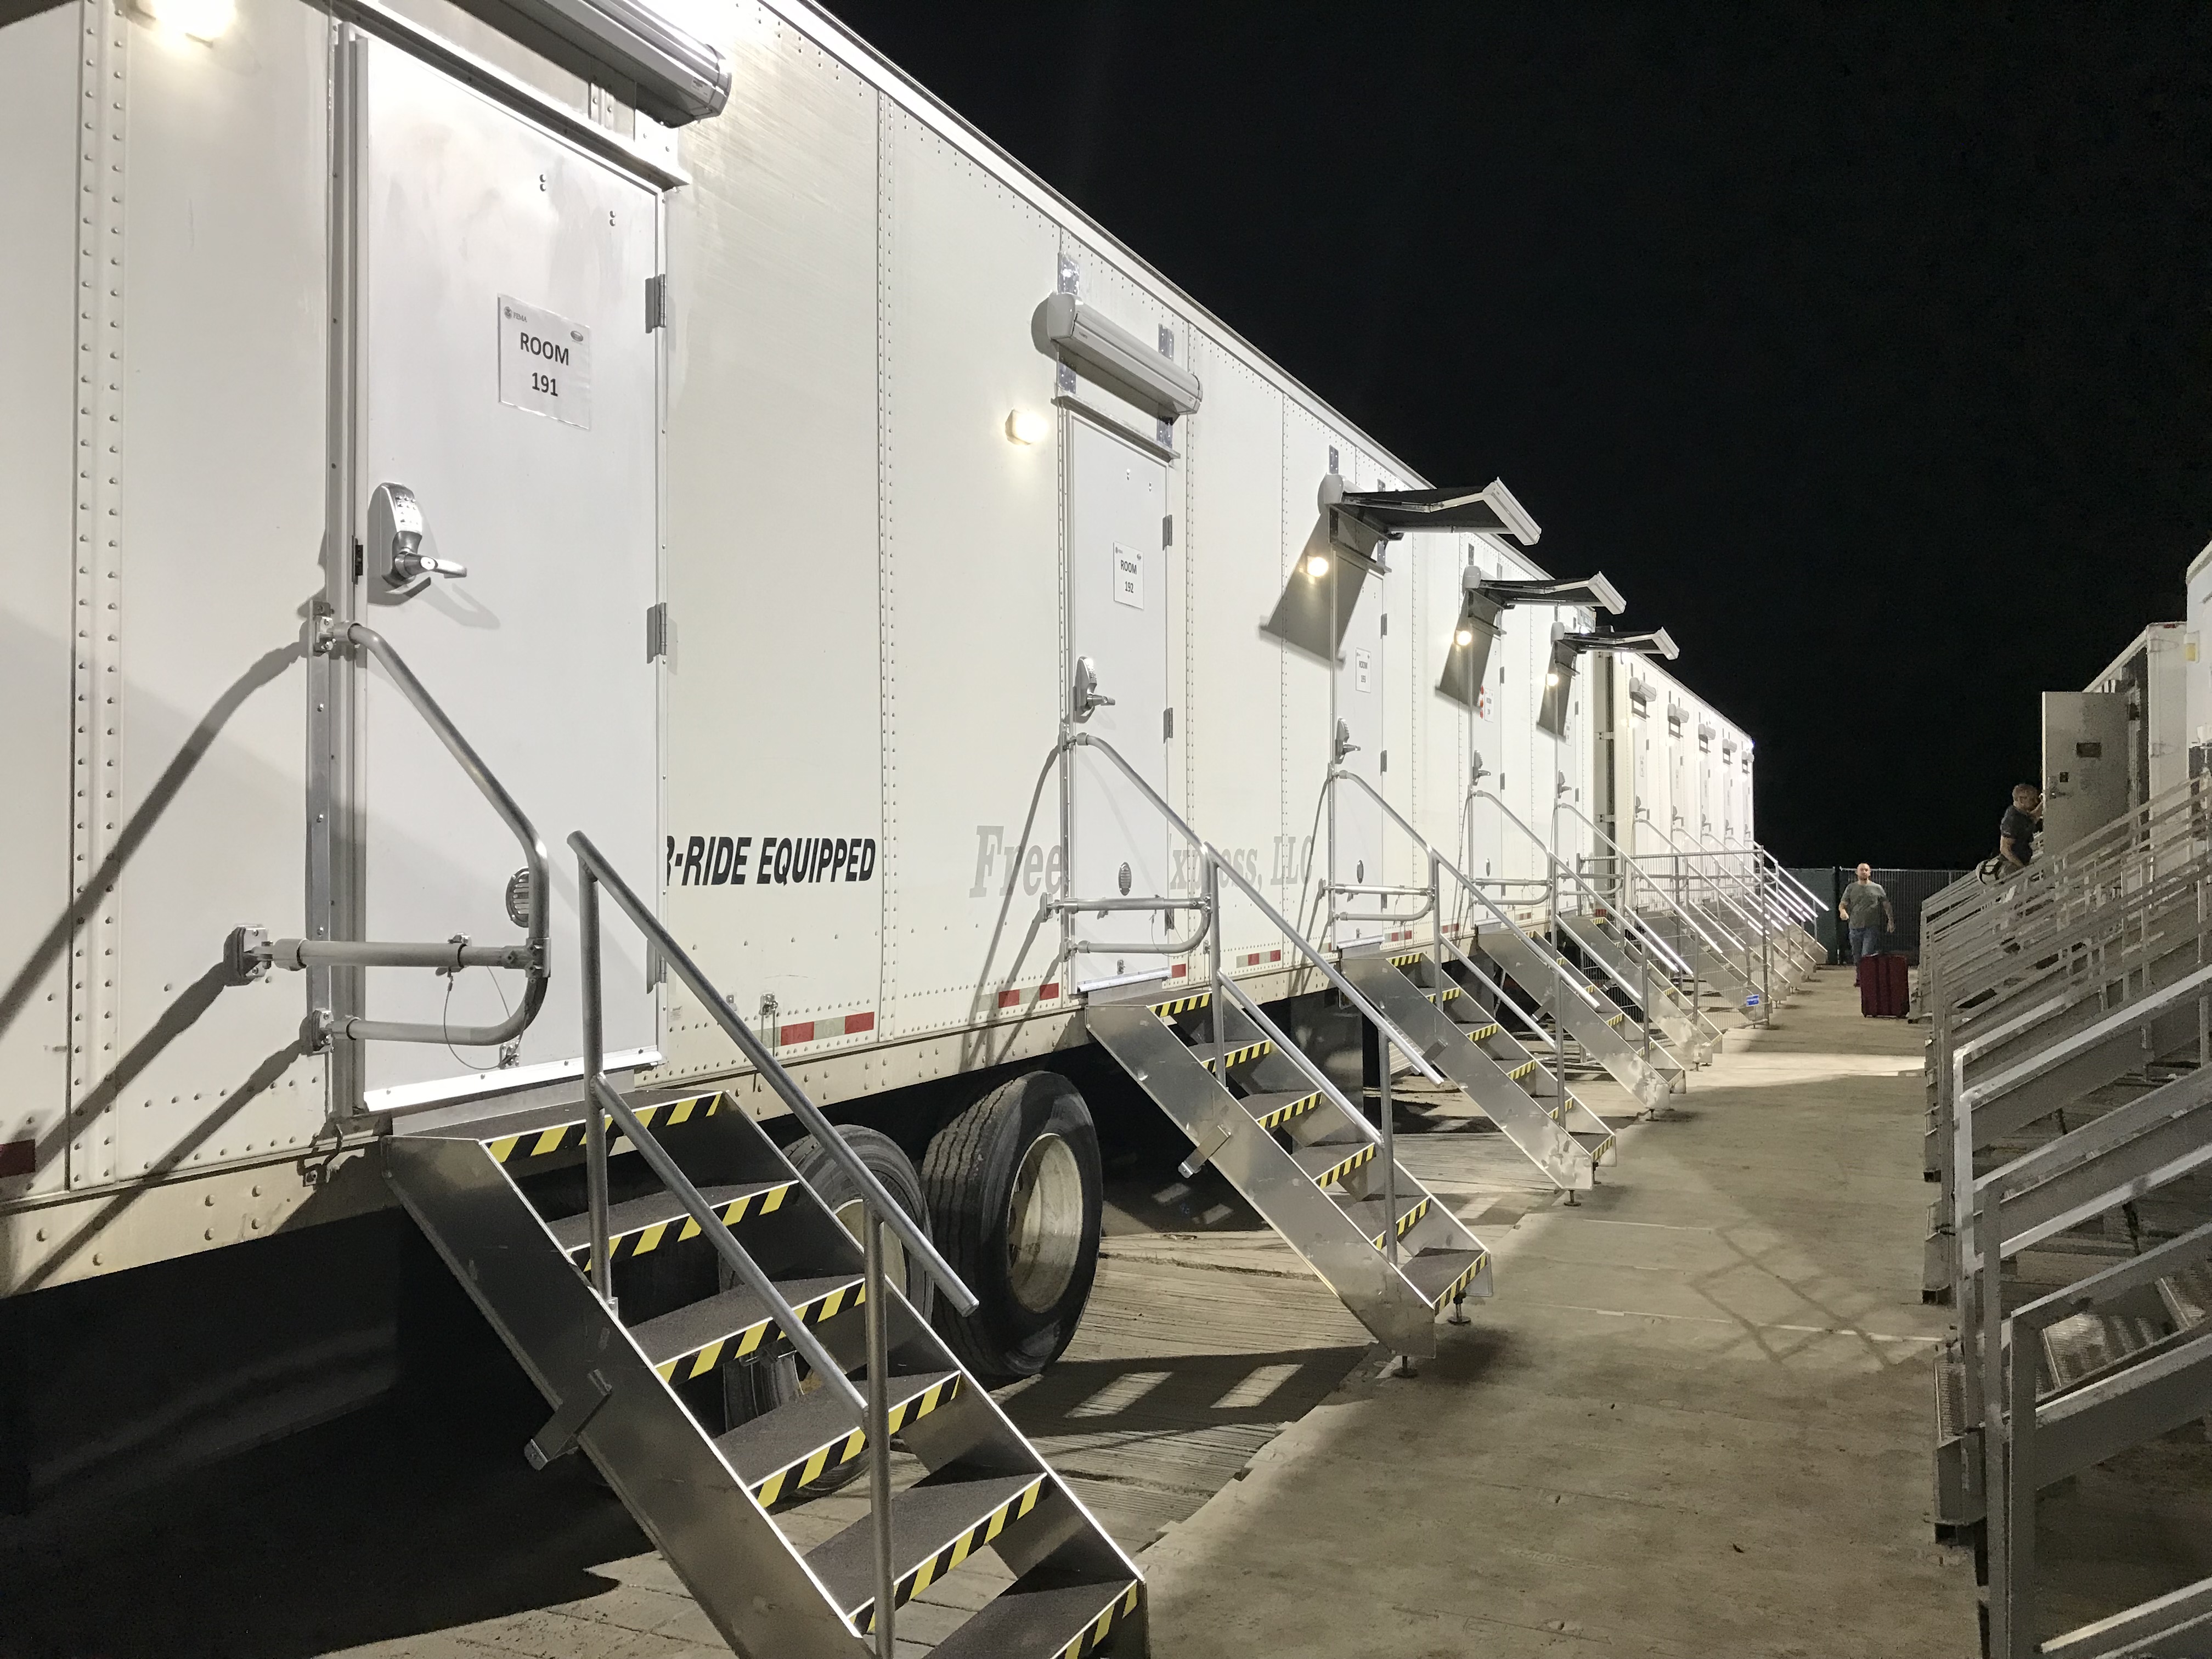
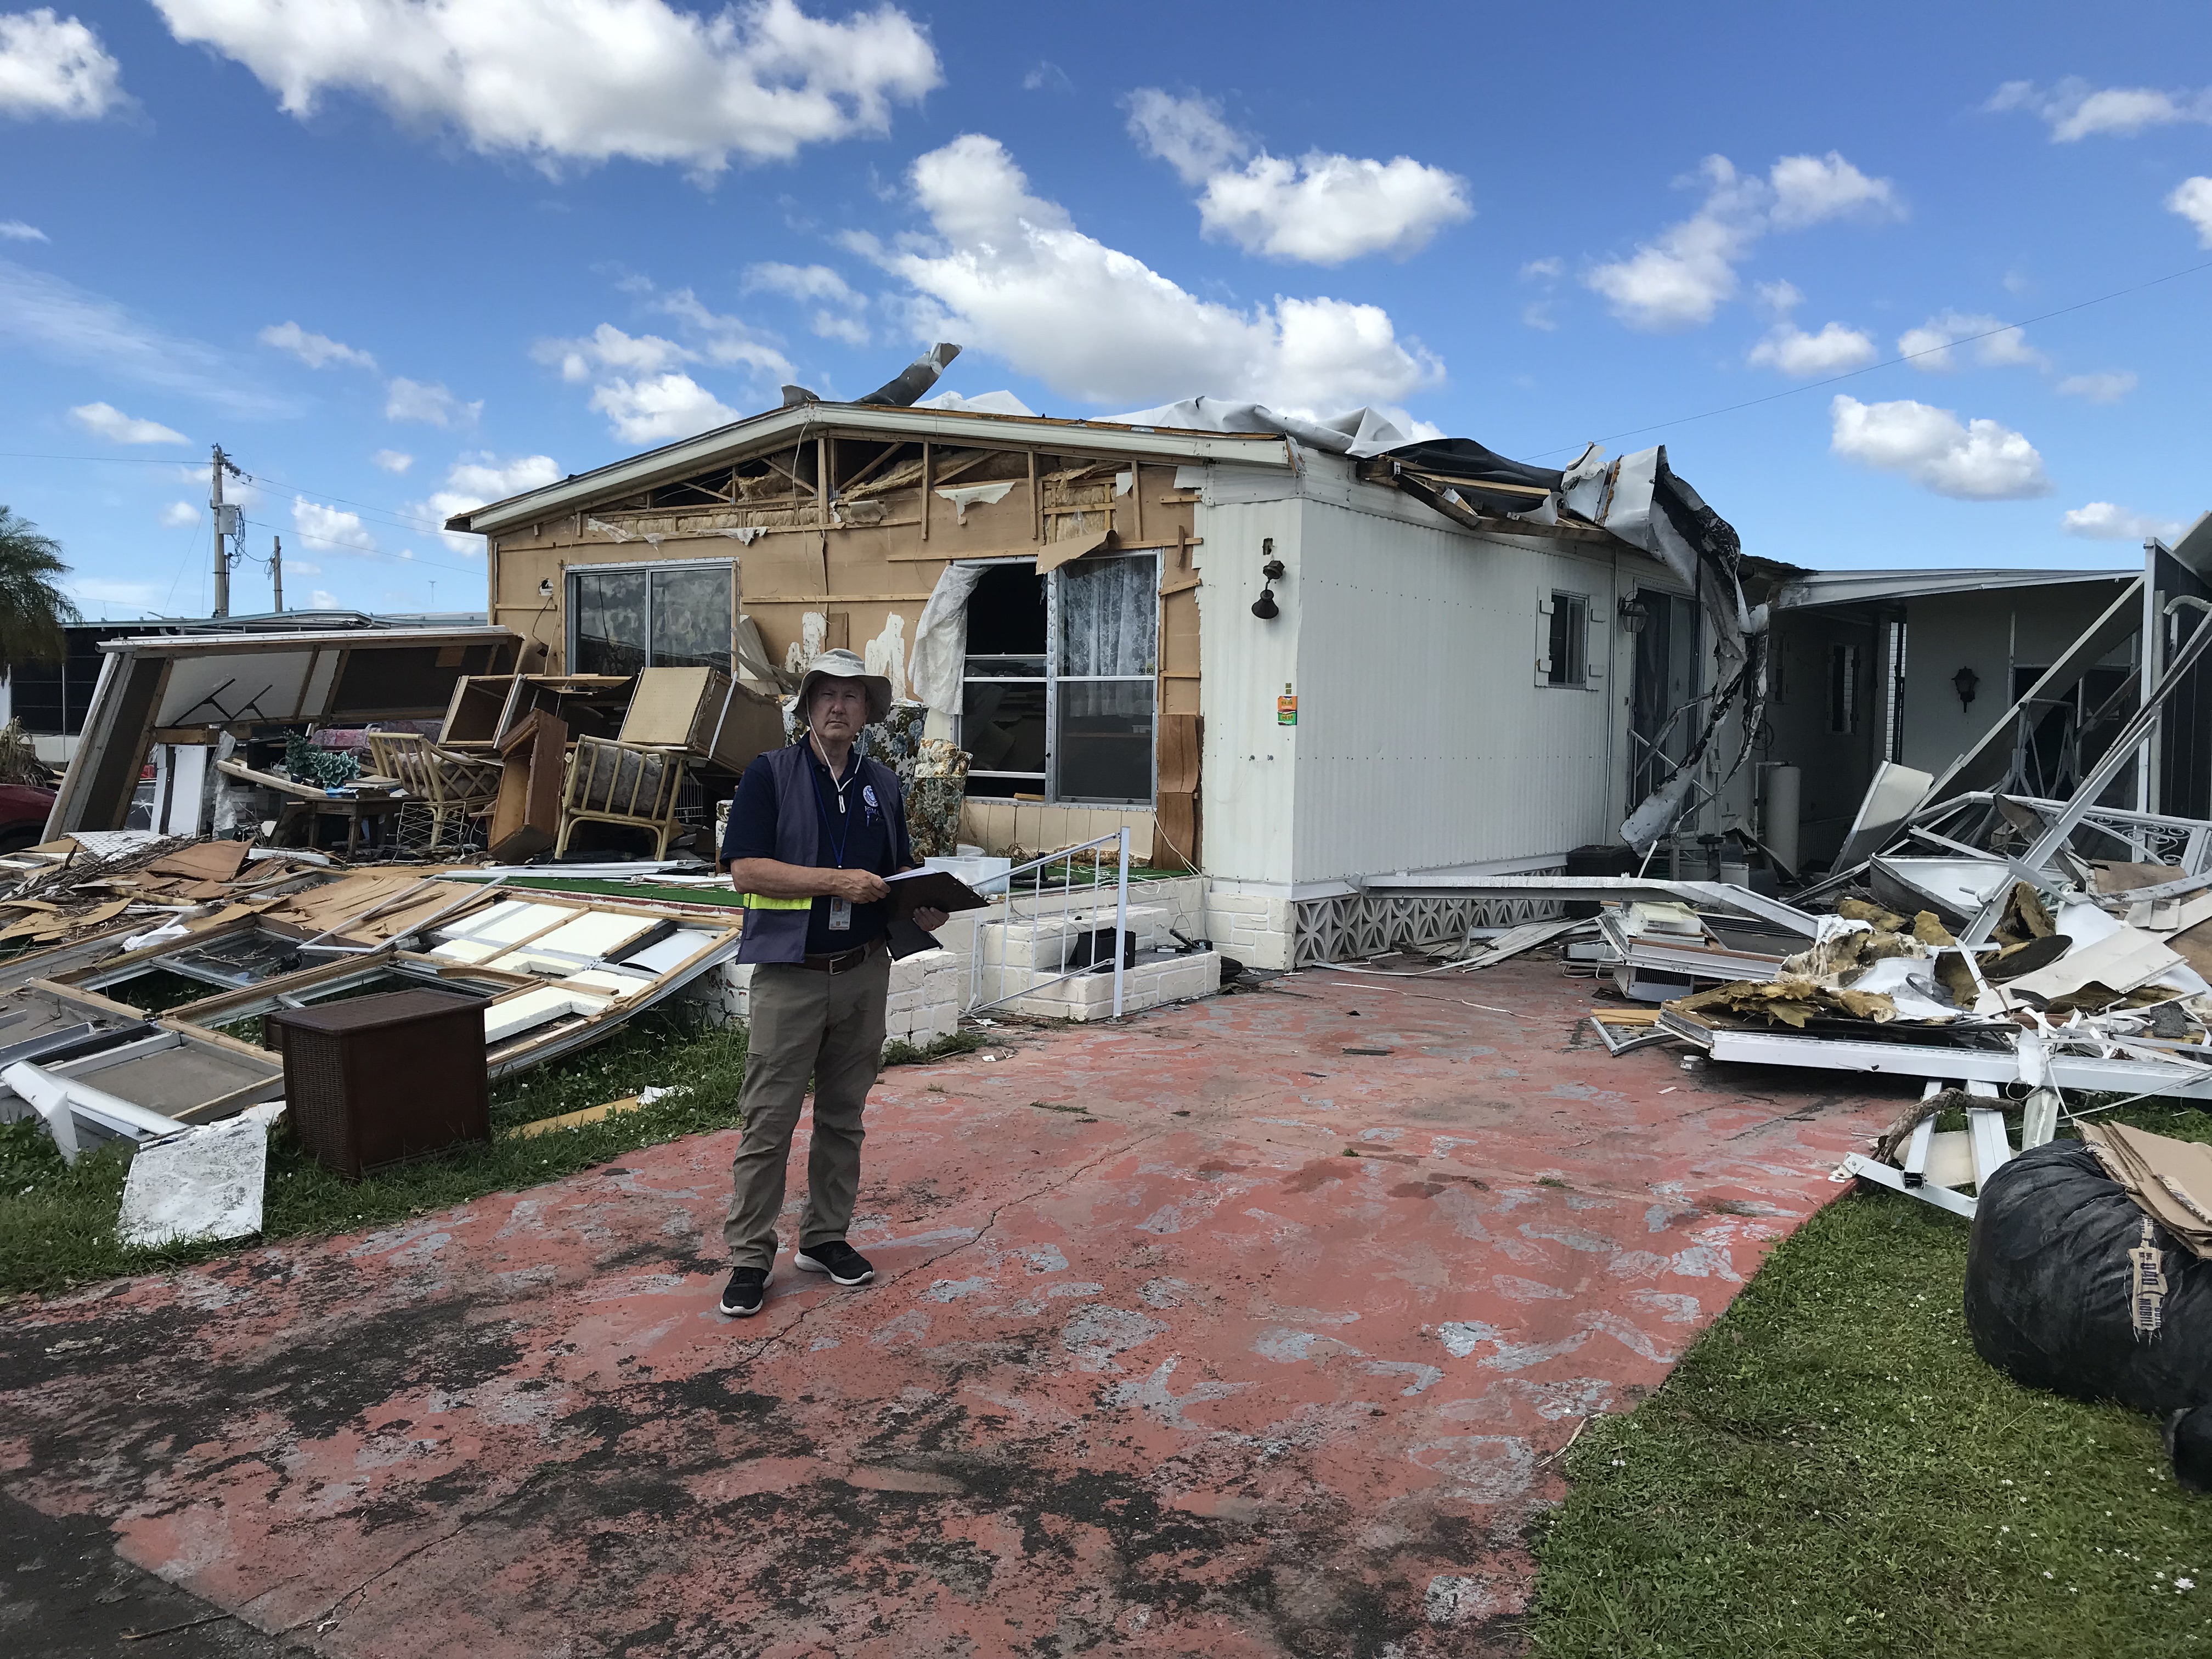
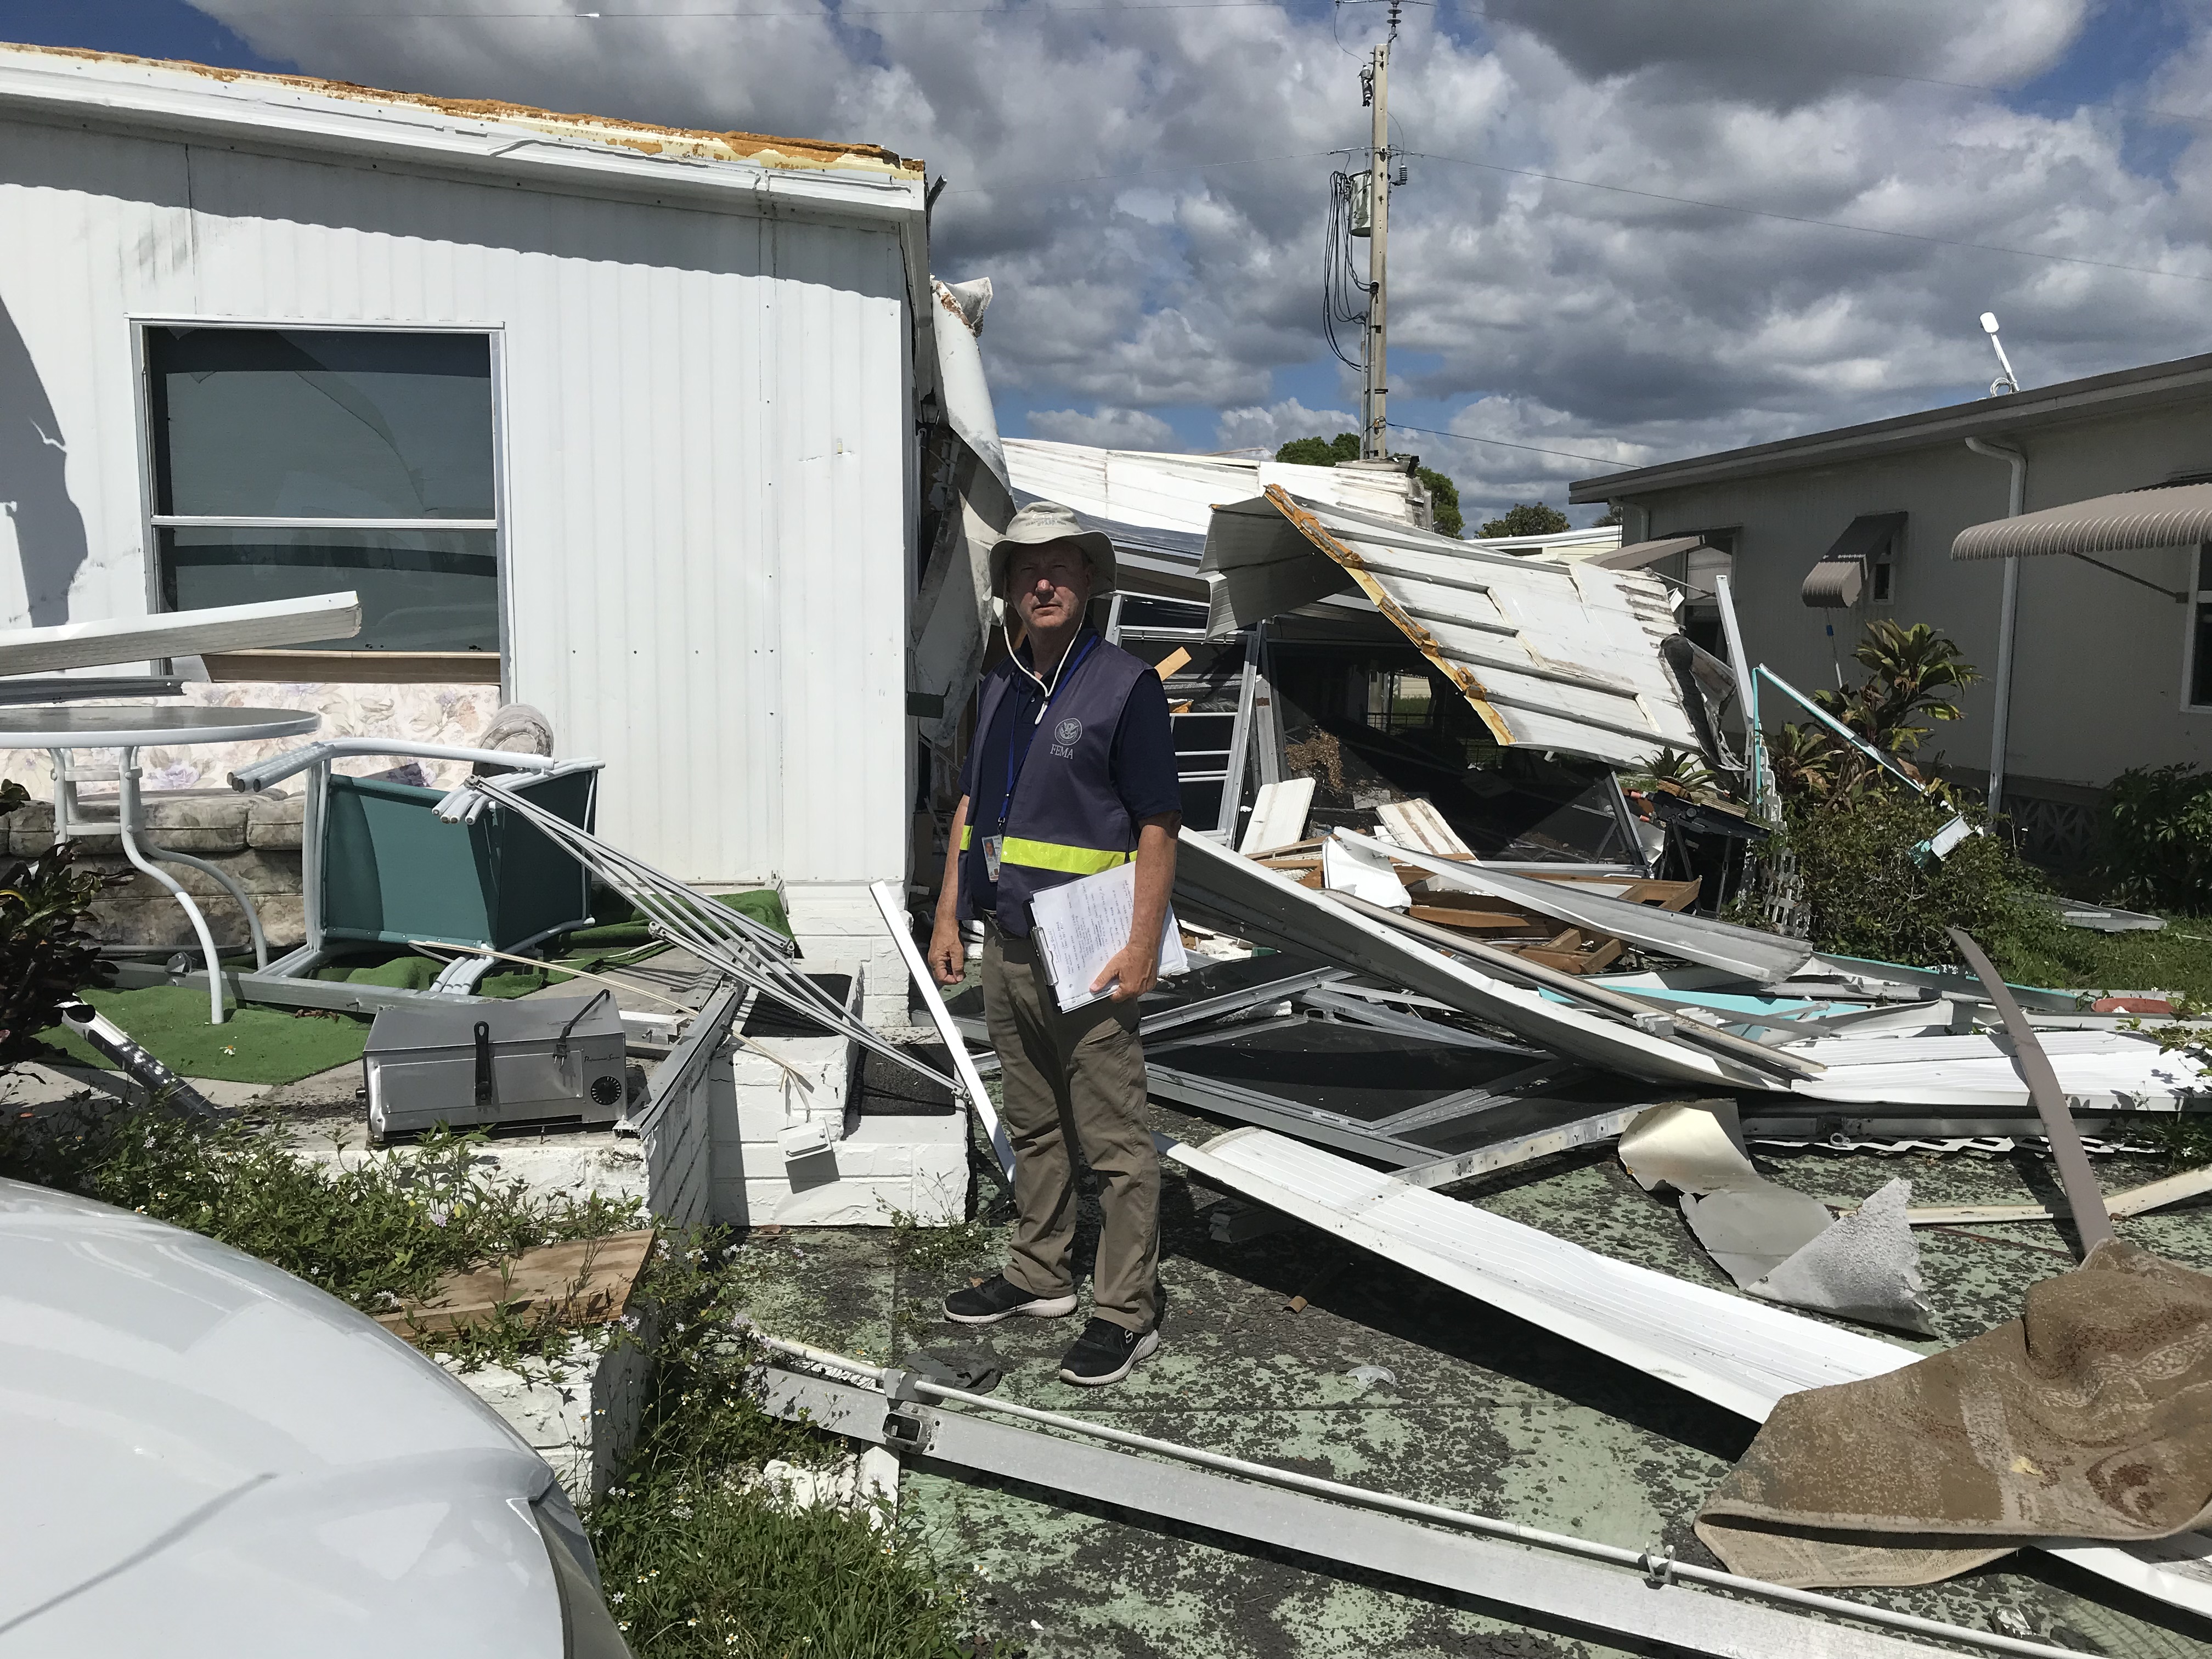
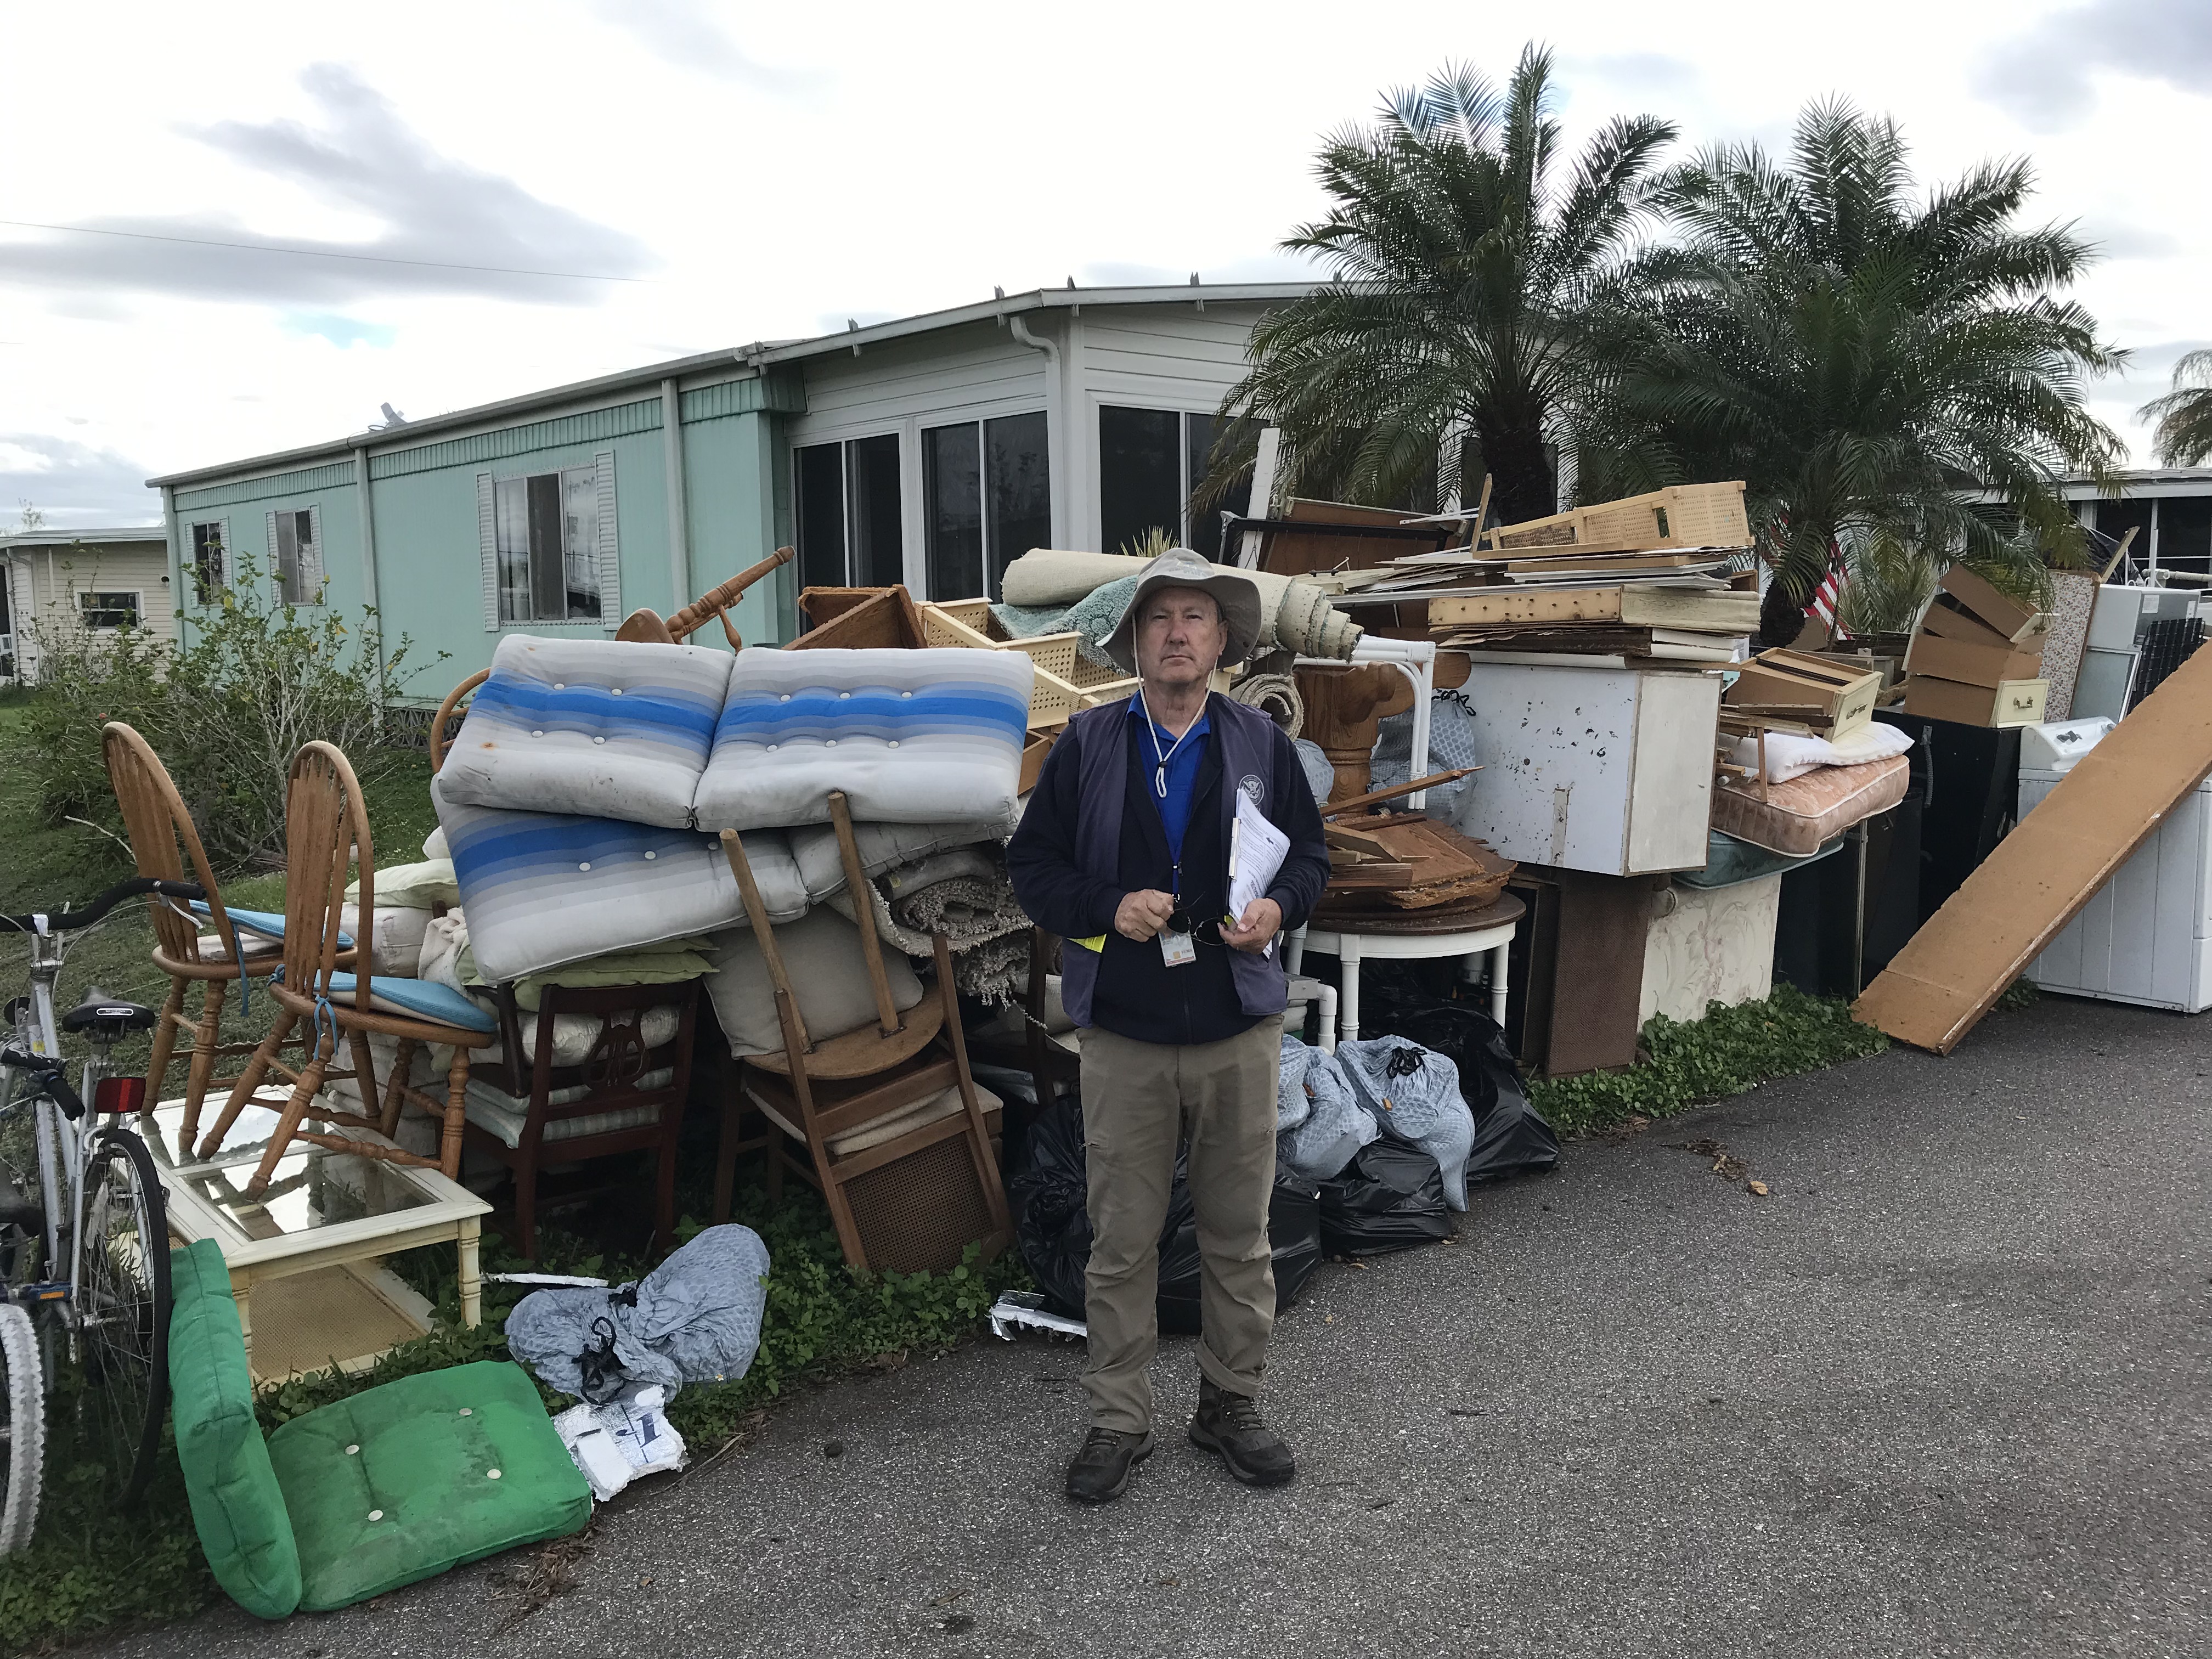
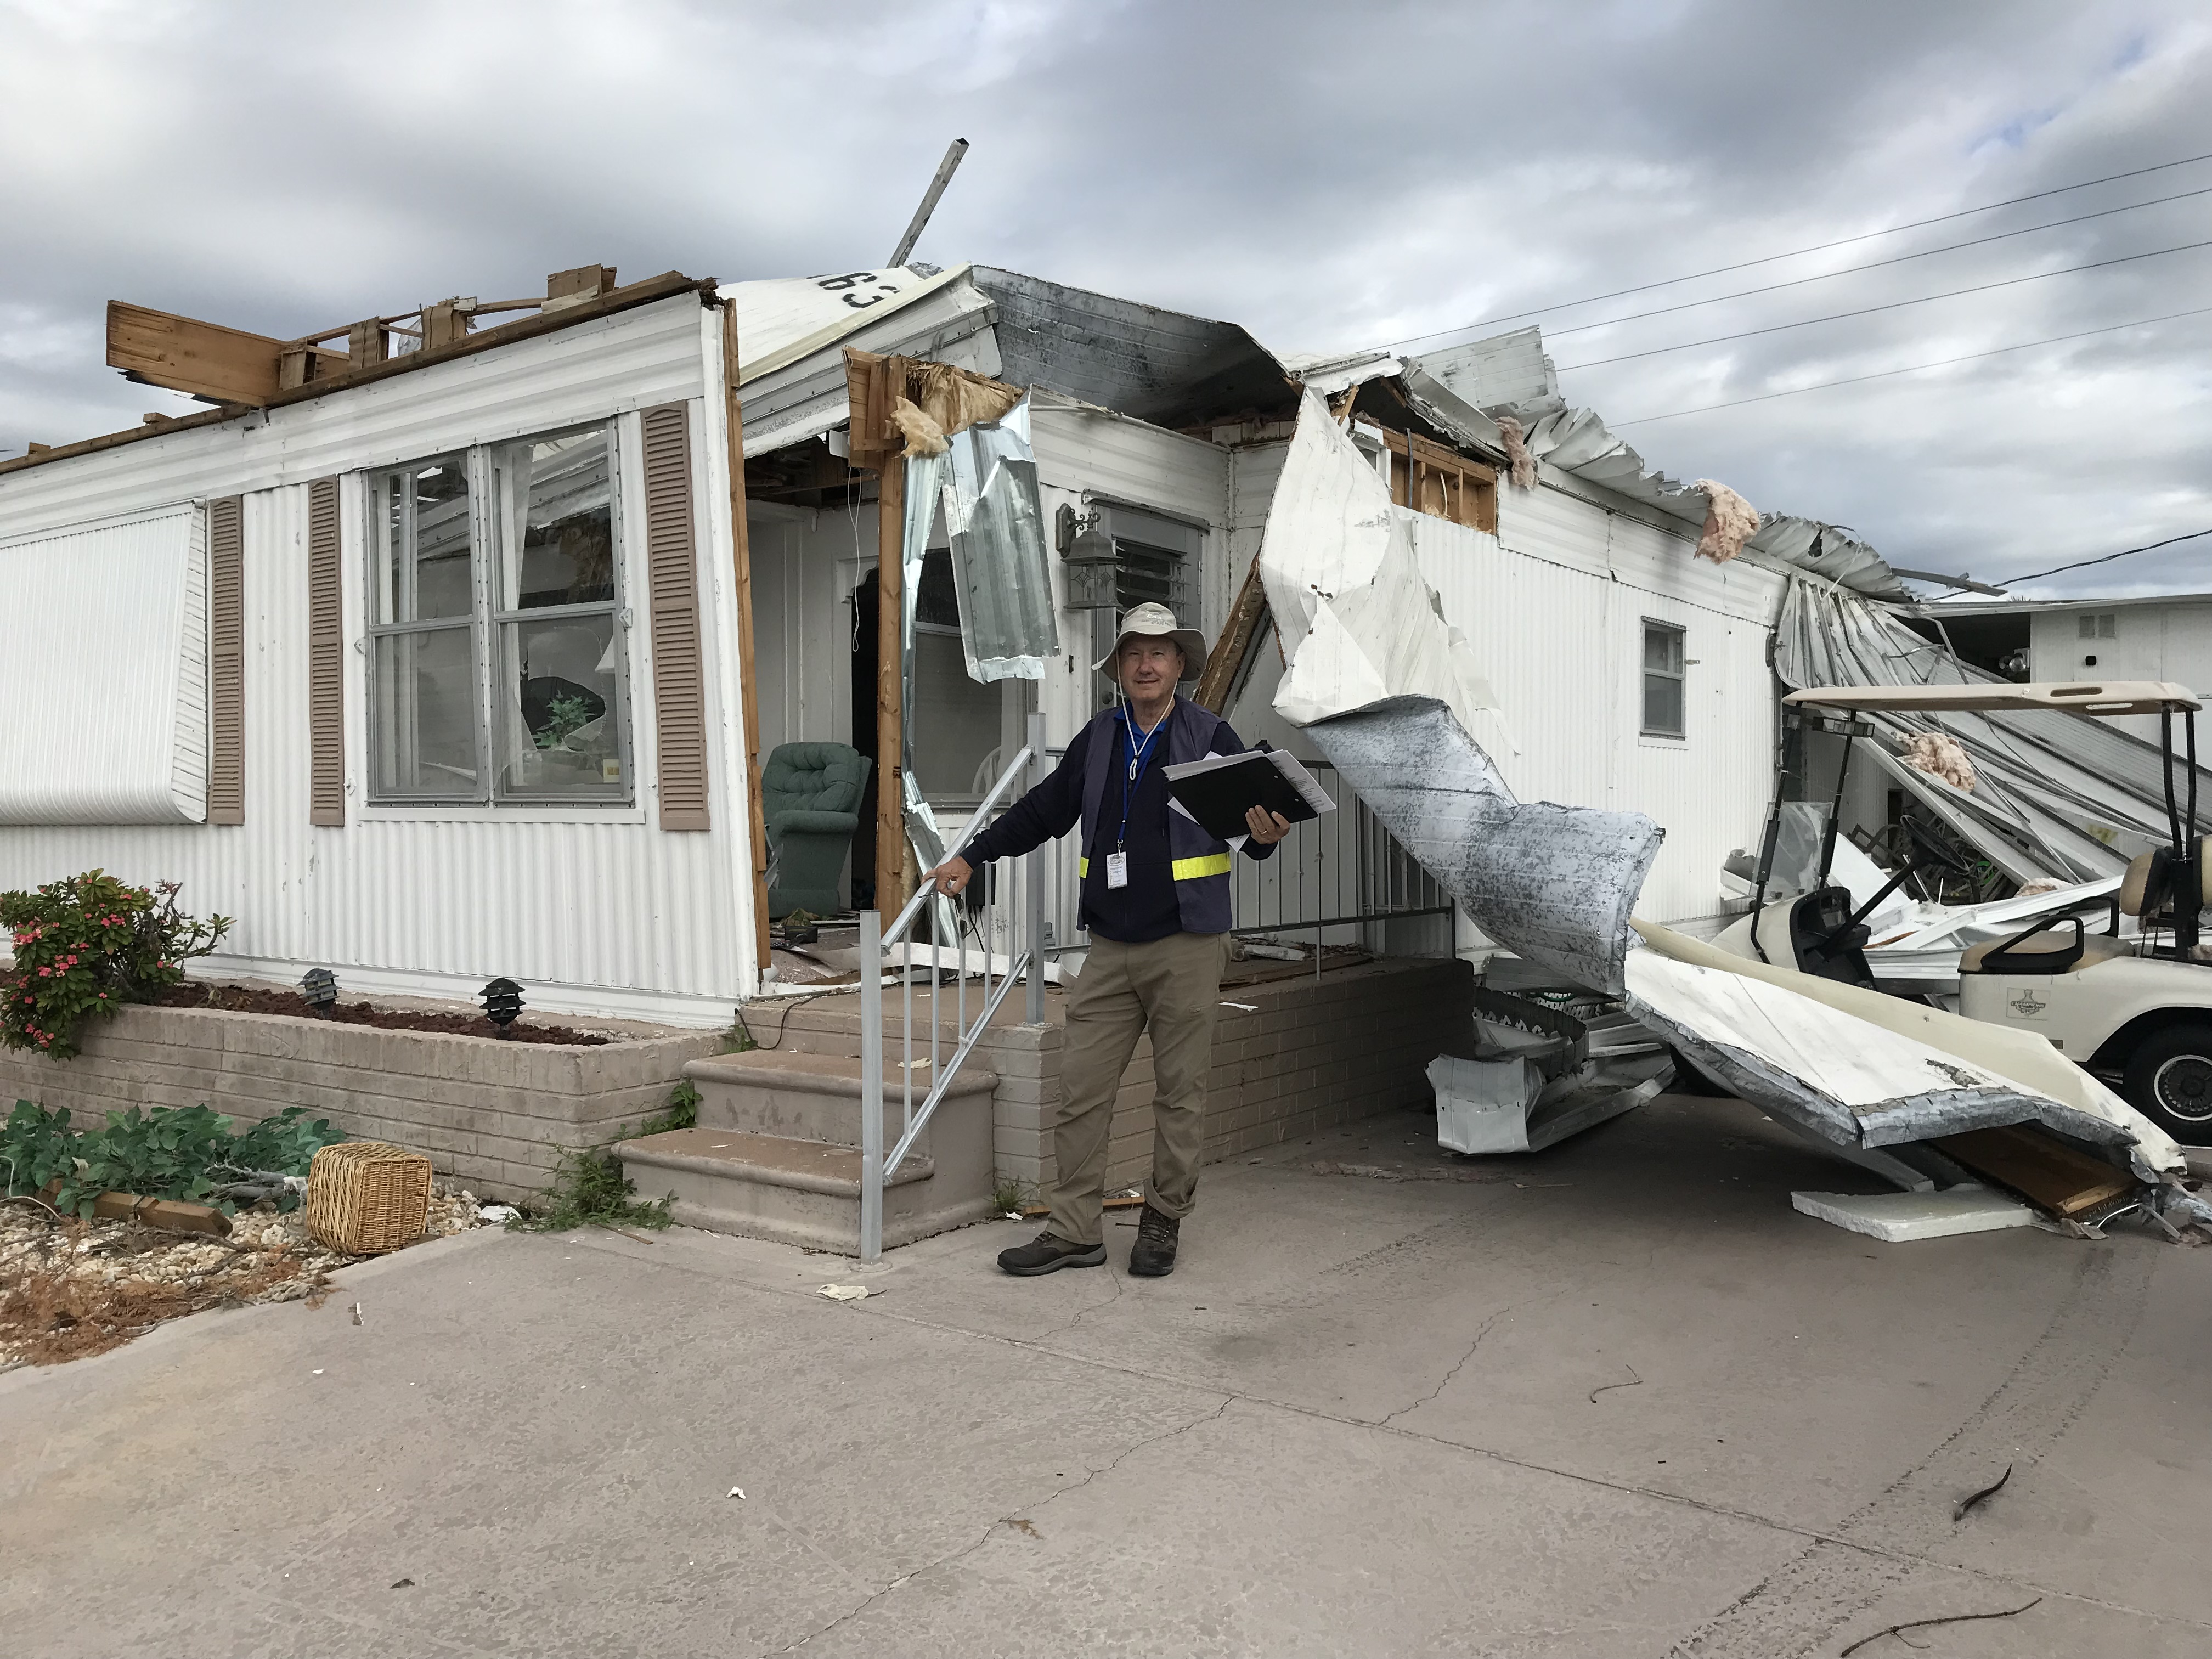
In the intervening years we’ve been on numerous disaster deployments across the US, engaging with so many individuals and families who’ve been devastated, to help them start back on a road to recovery. Hard, challenging, but worthwhile.